Why Simulation Beats Manual Estimation — and How IST PVSolar Simulator Gets It Right
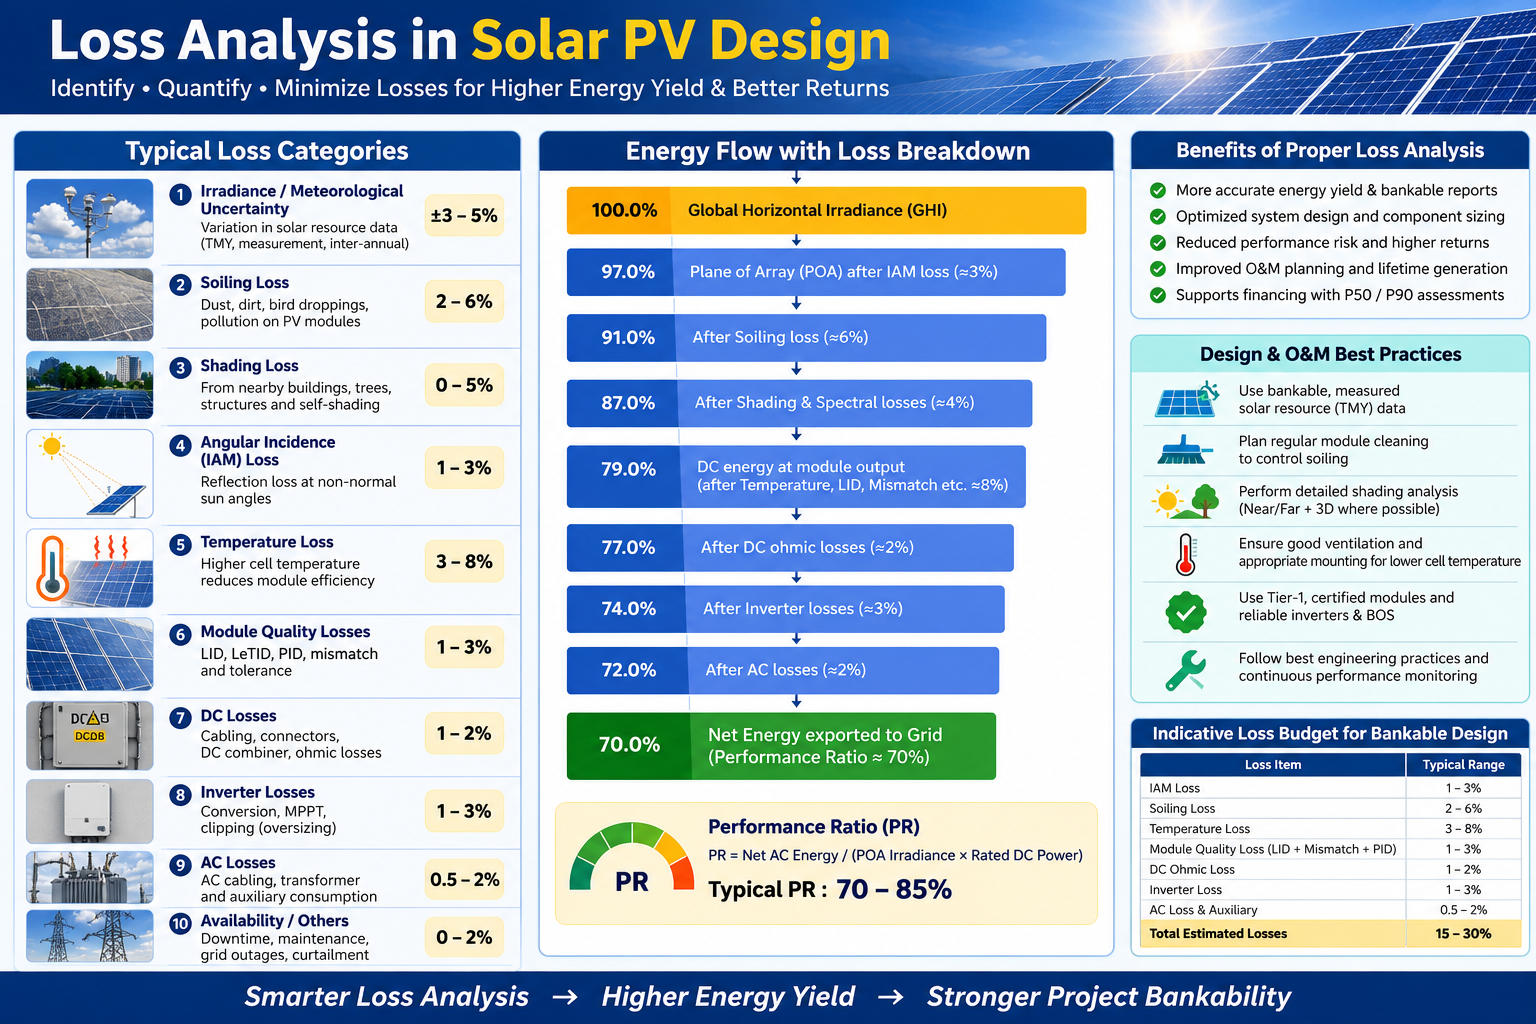
Every solar PV project lives or dies on one number: the energy it will actually deliver over its lifetime. That number is never the "nameplate" capacity of the modules — it's nameplate capacity minus everything that chips away at it along the way: soiling, temperature, shading, wiring resistance, inverter clipping, mismatch, degradation, and a dozen smaller effects that stack on top of each other.
How accurately you capture those losses determines whether a project is bankable, whether an investor's IRR model holds up, and whether an EPC's performance guarantee is one they can actually stand behind. This is exactly where the gap between human-estimated losses and simulation-calculated losses shows up — and why that gap matters more than most people realize.
The old way: human-driven loss estimation
For years, a large share of the industry has leaned on a shortcut: apply a single lump-sum "performance ratio" or a handful of flat derating percentages pulled from a spreadsheet template, a past project, or a rule of thumb someone picked up early in their career.
That approach has real limits:
- It's static, not site-specific. A flat 2% soiling loss or a generic 3% shading allowance doesn't know whether the site is in a dusty agricultural belt or a coastal city with regular rain, or whether a neighboring building casts a shadow for two hours every winter afternoon.
- It compounds human bias. Two engineers estimating the same project by hand will rarely arrive at the same loss stack — one may be conservative on temperature derating, another optimistic on inverter clipping, and neither has a way to prove which is closer to reality.
- It hides interactions between losses. Shading doesn't just reduce irradiance — it interacts with string configuration, bypass diode behavior, and mismatch in ways a flat percentage can't represent.
- It's hard to audit. When a lender's due-diligence team asks "how did you arrive at this number," a spreadsheet assumption is a much weaker answer than a documented, model-driven calculation.
None of this means engineers were doing careless work — manual loss estimation was, for a long time, the only practical tool available. But it left a structural gap between the design on paper and the plant's actual behavior in the field.
The simulation approach: modeling losses instead of guessing them
A simulation-based workflow replaces each of those flat assumptions with a physical model that responds to the actual project inputs — location, geometry, equipment, and layout — instead of a number carried over from the last project.
This is the core design philosophy behind IST PVSolar Simulator: rather than asking the user to supply a single "system loss" percentage, it calculates each loss category from first principles and lets them combine the way they actually do in a real plant.
A few examples of what that looks like in practice:
How this leads to optimum design — without human error
The practical benefit isn't just "more accurate numbers." It changes how design decisions get made:
- Iteration becomes cheap. Because losses are recalculated automatically from the model rather than re-estimated by hand, a designer can test row spacing, tilt angle, string sizing, or inverter selection dozens of times and immediately see the real yield impact of each change — something that's impractical when every iteration means re-deriving manual assumptions.
- Human transcription error disappears. A flat-percentage workflow depends on someone correctly remembering to apply the right derating factor for the right site condition. A simulation engine applies the same physics consistently every time, removing the "I forgot to adjust for altitude" or "I used last year's soiling number" class of mistakes.
- Design choices are tested against uncertainty, not just a single average year. With P50/P75/P90/P95 exceedance probability analysis built on thousands of simulated scenarios, a design isn't just optimized for an average year — it's stress-tested against the range of outcomes a lender or investor actually cares about.
- Compliance is designed in, not checked afterward. Protection and cable-schedule calculations aligned to CEA and IS 16169, MNRE CO₂ factors, and ALMM-ready module data mean the design that comes out the other end is already aligned with the standards an Indian project needs to meet — rather than relying on someone remembering to cross-check every clause separately.
Why this raises accuracy specifically
Accuracy in loss analysis isn't really about picking better guesses — it's about reducing the number of assumptions between the input data and the final answer. Every time a flat percentage stands in for an actual calculation, it introduces a hidden uncertainty that doesn't show up anywhere in the report.
A granular, physics-based approach narrows that gap in three concrete ways:
- Losses respond to the real project, not to whichever template was closest at hand — so a shaded urban rooftop and an open-field utility plant genuinely get different, appropriately-calculated results instead of the same rule-of-thumb percentage.
- Interactions between losses are captured, instead of adding independent percentages together, which tends to either overstate or understate the combined effect depending on the specific site.
- The exceedance-probability output (P50–P95) gives lenders and investors a real uncertainty band, grounded in simulated variability, rather than a single point estimate with no stated confidence level.
The result is a yield and financial model that holds up better under third-party due diligence — which is, ultimately, the real test of whether a loss analysis was "accurate."
Is it better than other simulators?
This deserves an honest answer rather than a marketing one. Established tools in this space — each have deep, well-proven modeling capability, and many have been industry standards for years for good reason. "Better" isn't a single universal ranking; it depends on what a given project or team actually needs.
Where IST PVSolar Simulator's approach is distinct is in how tightly the loss modeling, India-specific compliance content, and bankability reporting are integrated into one workflow:
- Built-in alignment with CEA and IS 16169 protection/cable requirements and MNRE CO₂ factors, rather than needing a separate compliance pass.
- ALMM-ready module database fields and PM Surya Ghar / DPR-style report layouts, aimed specifically at the Indian residential, C&I, and utility-scale market and its documentation conventions.
- A single platform spanning yield simulation → electrical design → bankability/DSCR reporting, so the loss assumptions used in the energy model are the same ones that flow through to the financial due-diligence output — instead of re-entering numbers across separate tools.
For teams working specifically within the Indian regulatory and market context, that end-to-end, standards-aligned integration is a genuine practical advantage over stitching together a generic international yield tool with separate compliance and reporting workarounds. For other contexts, the right tool is the one that best matches the regulatory environment, project type, and workflow a team already has — and that's a comparison worth making on your own project's specifics rather than taking any vendor's word for it, IST PVSolar Simulator included.
The bottom line
Manual loss estimation isn't wrong so much as it's a blunt instrument — fast, familiar, but blind to the site-specific physics that actually determine energy yield. Replacing flat assumptions with a modeled, physics-based loss stack — the way IST PVSolar Simulator approaches it — doesn't just produce a "more accurate number." It changes the design process itself: faster iteration, fewer human errors, uncertainty that's actually quantified, and a report that's built to survive scrutiny from the people writing the checks.