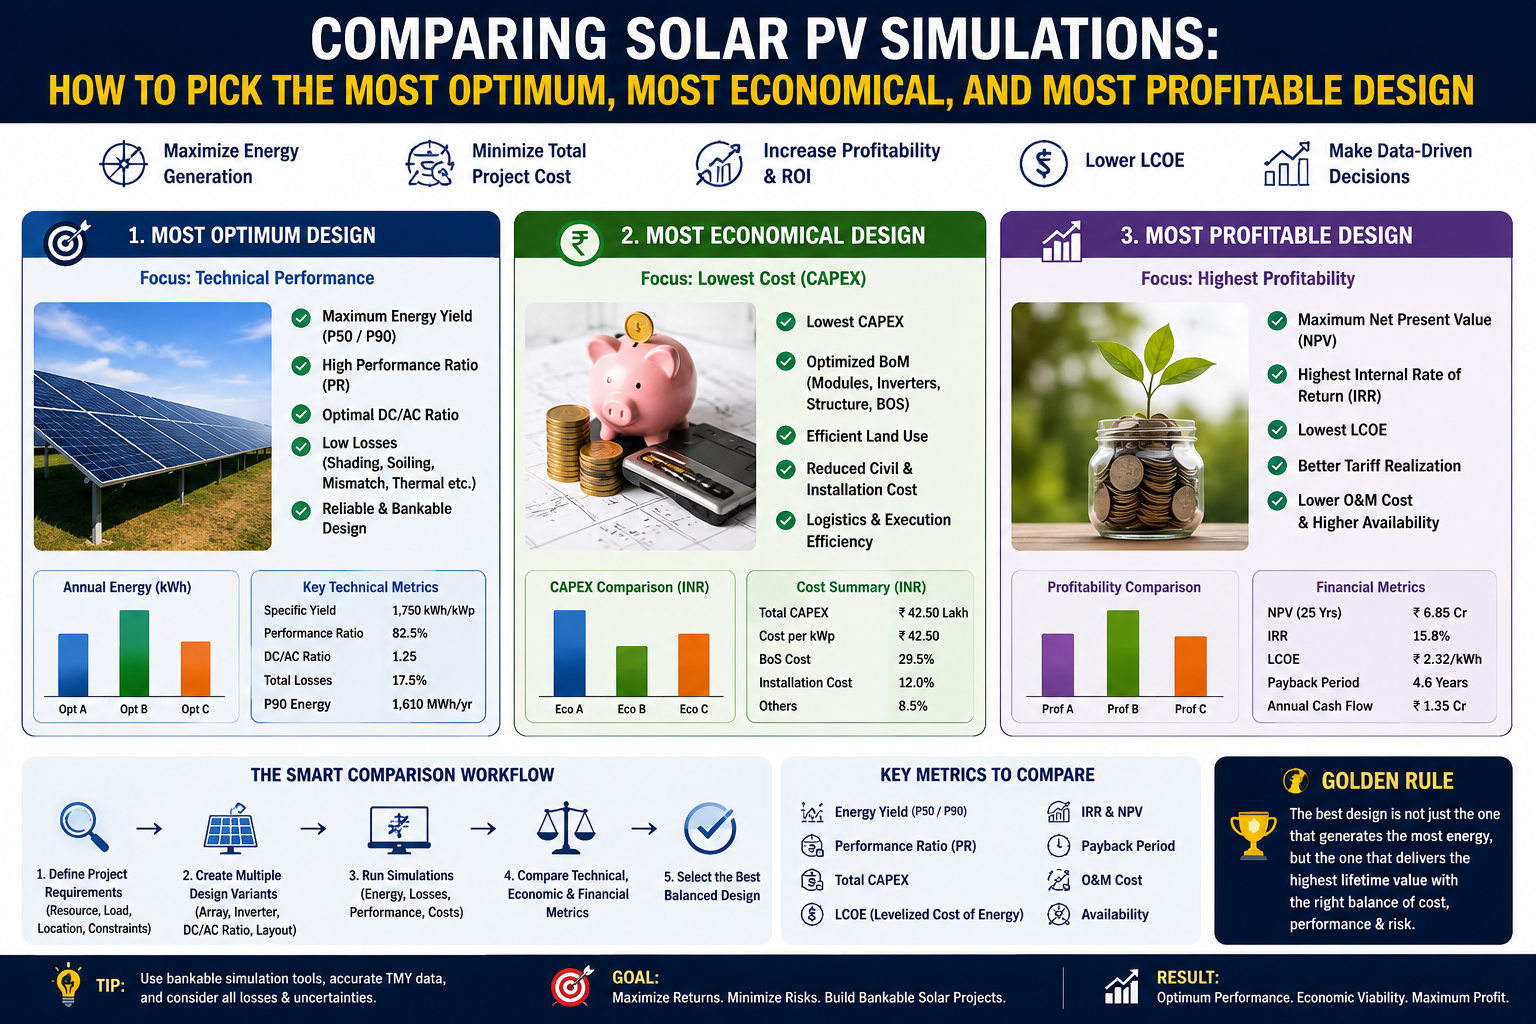
Comparing Solar PV Simulations: How to Pick the Most Optimum, Most Economical, and Most Profitable Design
Every solar PV project starts with a question that looks simple but rarely has a simple answer: which design should we actually build?
Change the tilt by a few degrees. Swap one inverter model for another. Push the DC/AC ratio (ILR) a little higher to squeeze more modules onto the same racking. Each tweak produces a slightly different simulation — a different DC capacity, a different annual yield, a different CAPEX, a different payback period. Run five or six of these variations and you're suddenly staring at a spreadsheet of numbers with no obvious "winner."
This is where a structured simulation comparison earns its keep. Instead of eyeballing rows of kWp, PR, and CAPEX, the goal is to rank every design option against three distinct questions — because "best" isn't one thing in solar. It's three:
- Which design performs best as an engineering system? → Most Optimum
- Which design costs the least to deliver each unit of energy? → Most Economical
- Which design makes the most money over its life? → Most Profitable
These three answers can — and often do — point to three different designs. Understanding why is the whole game.
Why "Most Economical" Isn't the Same as "Most Optimum"
Economics asks a colder question: how much does each unit of energy actually cost to build?
This is where CAPEX enters the picture — but with an important caveat. Interestingly, a higher ILR often helps here: running more DC capacity through the same inverter spreads the fixed inverter cost over more energy, even if it means accepting a bit more clipping. That's why the "most economical" design and the "most optimum" design frequently diverge — the economical pick tolerates slightly more clipping than the purist technical answer would.
Why "Most Profitable" Needs the Full Financial Picture
Profitability is the least forgiving of the three lenses, because it depends on more than the plant itself — it depends on tariffs, escalation, discount rates, taxes, and time.
Early in the design process, before a full financial model has been run, profitability can only be estimated with a proxy: Est. Income/yr, based on annual energy × tariff. It's useful for a first pass, but it ignores degradation, OPEX, financing, and the time value of money.
Once a full Financial Analysis has been run for each design — CAPEX, OPEX, tariff escalation, discount rate, project life — profitability should be judged the way a lender or investor actually judges it:
- Net Present Value (NPV) — the design that creates the most value in today's currency
- Internal Rate of Return (IRR) — the design with the strongest return relative to capital deployed
- Payback period — how fast the initial investment is recovered
- Lifetime profit — total cash generated over the full project life
This is also the point where a proper Multi-Criteria Decision Matrix becomes possible — one that blends all three lenses instead of ranking them in isolation:
Technical justification
- Highest annual energy generation
- Acceptable inverter clipping (< 2.5%)
- High Performance Ratio
Economic justification
- Lowest LCOE
- Best cost per annual kWh
- Optimized use of Balance-of-System (BOS) capacity
Financial justification
- Highest NPV
- Highest IRR
- Shortest payback period
- Maximum lifetime profit
A design that scores well across all three groups — not just one — is the one worth taking to detailed engineering.
Why the IST PVSolar Simulator Matters for Comparing Solar PV Simulations
Designing a solar plant is rarely a one-shot exercise. Tilt, azimuth, module selection, inverter sizing, row spacing, ILR, bifacial gain assumptions, loss factors — every one of these is a dial you can turn, and turning any of them changes the outcome. The real design work isn't running one simulation. It's running many, and knowing which one to build.
Why the AI/ML Recommendation Layer Matters
A table of ten simulations is progress, but it's still a lot to manually cross-reference. This is where the tool's built-in recommendation engine earns its place — it scores every saved simulation across the three lenses that actually matter in solar development, and tells you, plainly, which design wins where:
- ⚙ Most Technically Optimum — weighing ILR sweet-spot, Performance Ratio, clipping acceptability, and Specific Yield, so an oversized array with poor clipping behavior doesn't get mistaken for the best design just because it's bigger.
- 💰 Most Economical — weighing cost per annual kWh and cost per installed Watt against ILR, using CAPEX pulled live .
- 📈 Most Profitable — weighing income potential early on, and automatically upgrading to full NPV, IRR, and payback-based scoring once Financial Analysis has been run for each design.
Critically, this runs entirely on-device — a transparent, rule-based Multi-Criteria Decision Matrix, not a black-box output. Every score is traceable back to the exact weighting and the exact numbers in the comparison table, which matters enormously when a design decision has to be explained to an EPC, a lender, or an investment committee.
Why This Matters in Practice
For an EPC or independent consultant, the value isn't abstract:
- Faster iteration — test five ILR variants in the time it used to take to properly evaluate one.
- Defensible design choices — a documented, numbers-based reason for choosing one configuration over another, not a gut call.
- Bankability-ready outputs — P50/P75/P90/P95 exceedance probabilities, LCOE, NPV, and IRR feeding straight from the same simulation the design decision was based on.
- Consistency across a portfolio — the same scoring logic applied project after project, so comparisons are apples-to-apples even across a pipeline of sites.
Solar design has always involved trade-offs between performance, cost, and return. The IST PVSolar Simulator doesn't remove those trade-offs — no tool can — but it makes them visible, comparable, and traceable, which is exactly what a design decision needs to hold up under scrutiny.
The Takeaway
There is rarely a single "best" solar PV design — there's a best engineering design, a best cost design, and a best investment design, and a good comparison process names all three instead of collapsing them into one number. Early on, simple proxies (ILR, clipping, cost ratios, estimated income) are enough to shortlist candidates. Once full financial analysis is available for each candidate, the comparison should graduate to NPV, IRR, payback, and lifetime profit — the metrics that actually decide whether a project gets financed.
Running the numbers this way doesn't just produce a recommendation. It produces a defensible one — the kind that holds up when a lender, an EPC, or an investment committee asks "why this design, and not the others?"