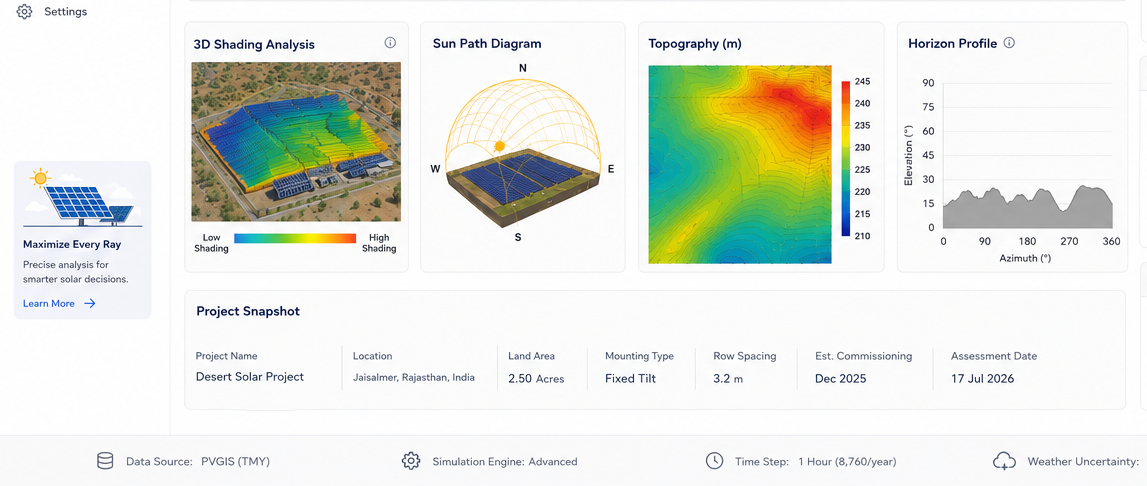
From Rooftop to Report in One Sitting: Inside a Modern Solar Site Assessment Tool
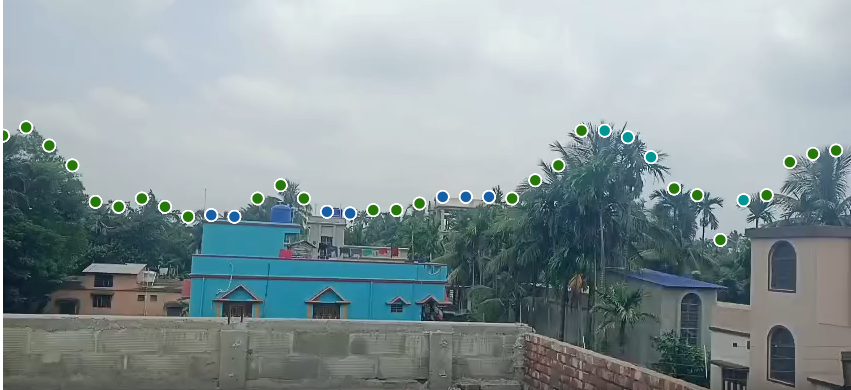
This Solar Site Assessement was built to compress that entire process — (a mix of specialized hardware - Solar Pathfinder charts, Solmetric SunEye units), survey, modeling, and reporting — into a single guided workflow you can run from a phone or laptop, without sacrificing the physics that make a shading analysis trustworthy in the first place. An on-device AI model (semantic segmentation) can also scan the footage itself, flagging trees, buildings, and terrain above a 10° elevation threshold and saving a confirmation frame for each one. it's a preliminary assessment
The problem with "quick" site assessments
Most lightweight solar tools fall into one of two traps:
- Too simple to trust. A flat "shading factor" percentage or a generic derate number that ignores where the sun actually is, hour by hour, relative to that specific tree line or roof parapet.
- Too heavy for a small job. Full engineering suites excellent job, and often overpriced — for a residential rooftop or a ground mount.
This platform sits deliberately in between: real astronomical modeling and real solar-resource data, wrapped in a workflow fast enough to run on-site while you're still standing on the roof.
A guided, eight-step workflow
The tool walks you through the assessment in a fixed sequence, and each step unlocks the next only once you've actually supplied what it needs — so nobody accidentally skips ahead and generates a report on incomplete data:
- Info — customer name, your company profile (name, logo, address, GSTIN, contact details — all reusable across future projects), site GPS coordinates, and hemisphere detection.
- Energy Calculation — electricity tariff and average monthly consumption, either typed in directly or derived automatically from a 12-month billing history.
- Design Info — rooftop or ground-mount, height above ground, module selection (500–700 Wp options), and system loss assumptions (soiling, mismatch, wiring, temperature, inverter efficiency).
- Import Resource — pulls a full year of hourly irradiance data for the site's exact coordinates.
- Capture Site — this is where the obstruction survey happens, and it's the most flexible part of the tool (more on that below).
- Site Area — trace or draw the installation boundary, place panels, and get an automatic usable-area and system-size estimate.
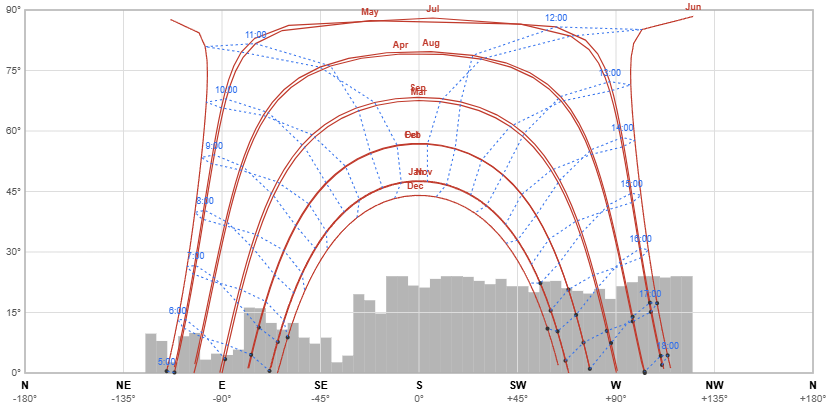
- Calculation — the sun-path diagrams, shading integration, and monthly energy yield all come together here.
- Report — a branded, print-ready PDF with everything above assembled into a client-facing document.
A report that came from an engineering firm
The output isn't a screenshot of a chart — it's a structured, multi-page report: company branding (logo, name, GSTIN, contact details) on every page, a site and system summary, sun-path diagrams, the traced installation area, the AI-detected obstruction gallery, and a full monthly production table and chart, closing with a clear call to action. It exports straight to PDF with a sensible default filename, so it's ready to email to a customer the same day the survey happened.