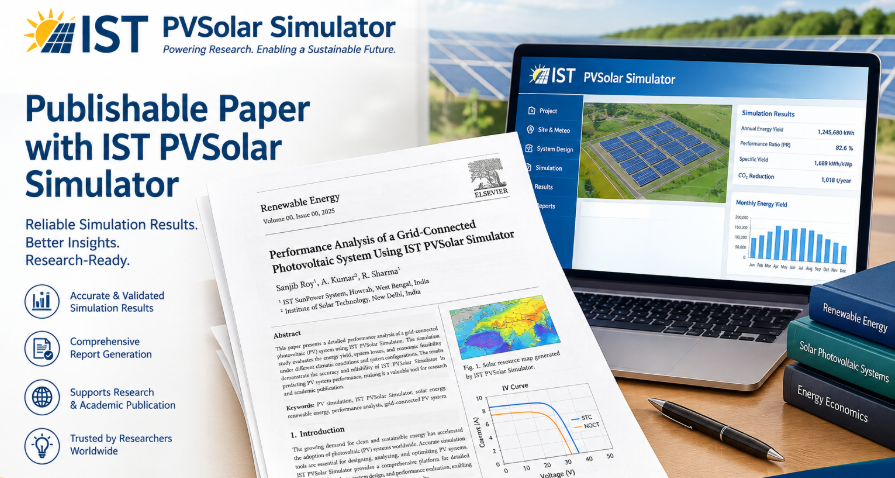
Turn One Simulation into a Publishable Paper with IST PVSolar Simulator
One well-configured simulation in IST PVSolar Simulator already holds most of what a solar paper needs: site data, a documented model chain, monthly results, losses, design studies and economics. The Research tab turns that run into publication-ready figures and tables, so your time goes into the argument rather than the plotting.
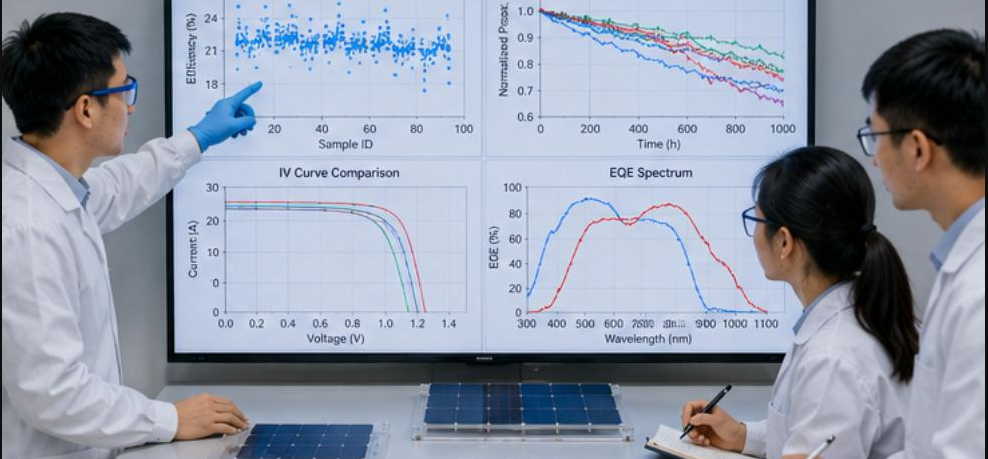
Why writing the paper is usually the slow part
Most PV engineers, students and researchers can run a simulation in an afternoon. Turning it into a manuscript can take weeks. You have to rebuild charts in a plotting tool, retype monthly tables and draw a methodology figure by hand. Then you check that every number in the text matches the model.
IST PVSolar Simulator closes that gap. After you run a project, the Research ▸ Project Analysis sub-tab reads the hourly results of that exact run. It generates the figures and tables a reviewer expects, each with SVG or CSV export. The numbers in your paper then come from one source: the simulation you can re-run and defend.
What you can publish from one project
The same simulation can feed five kinds of output. The difference is the question you ask of it, not the tool work.
Output | Core question | What the simulator supplies |
|---|---|---|
Research paper | Does a design choice (tilt, pitch, DC/AC ratio, bifacial, tracking) change yield or cost? | Tilt × azimuth map, row-pitch study, sensitivity table, LCOE/IRR grid |
Case study | How does a specific plant perform at a specific site? | Site climate charts, block diagram, monthly results, loss breakdown, daily profiles |
Validation study | How close is the model to metered output? | Recorded vs simulated table, S0 blind vs S4 as-built, monthly deviation, nMBE and CV(RMSE) |
Review or tool-utilisation paper | How do simulation methods compare, and how should a tool be used? | Modelling-chain figure, methodology figure, I–V/P–V curves, forecasting review |
Article or blog | What should a developer, investor or student take away? | A few headline charts, the annual results table, cash-flow chart |
From simulation to manuscript in eight steps
The workflow below takes a project from a blank site to a draft you can send to co-authors.
- Define the research question first. Write it in one sentence, for example: "How much does reducing row pitch cost in annual yield for a 5 MWp plant in Al Ahsa?" The question decides which figures you will need.
- Set up the site and weather. Enter the location and choose an hourly weather year. Prefer a measured TMY source such as PVGIS or NASA POWER over a synthetic year: forecasting and variability results need real day-to-day weather.
- Configure the plant as built or as designed. Select the module and inverter, string layout, tilt, azimuth, row pitch and losses. Record every assumption; it becomes your methods section.
- Run an hourly simulation. Project Analysis needs hourly resolution. Check the PR, specific yield and loss breakdown for plausibility before going further.
- Open Research ▸ Project Analysis and click Refresh. Every chart and table is rebuilt from the run you just made.
- Add measured data if you have it. Type 12 months of metered AC energy, or load them from the SCADA benchmark sub-tab. This unlocks the validation figures and the annual measured-vs-simulated table.
- Export what the paper needs. Download each figure as SVG (vector, scales to any journal size) and each table as CSV (paste into Word or LaTeX). Use the Publication Export sub-tab to collect research tables in one place.
- Write around the figures. Draft the results section figure by figure, then the methods from your recorded assumptions, then the introduction and conclusion last.
Figures and tables you get after one run
Project Analysis produces more than 40 figures and tables, each labelled with your project's own capacity, location and values. The table below maps them to the section of a paper where they usually belong.
Paper section | Figures and tables from Project Analysis |
|---|---|
Methodology | Modelling chain in IST PVSolar Simulator (8 steps, hourly loop); methodology of the review and validation; block diagram of the PV system |
Site and resource | Monthly GHI and POA irradiation with irradiance-weighted cell temperature; monthly GHI, mean air temperature and wind speed; GHI, sunshine duration and air temperature |
Design optimisation | Annual energy as % of optimum vs tilt and azimuth; tilt optimisation for a south-facing array; energy vs tilt; row-shading loss and ground coverage ratio vs row pitch |
Module behaviour | Modelled I–V curves at five irradiances and P–V curves at four cell temperatures |
Energy results | Monthly simulation results table; monthly AC energy with performance ratio; AC power on 21 June, 20 March and 21 December; loss breakdown |
Validation | Recorded and simulated monthly energy table (S0 blind, S4 as-built); grouped bars; monthly deviation; simulated vs recorded scatter; measured and simulated annual results with nMBE and CV(RMSE) |
Forecasting | Hour-ahead and day-ahead accuracy tables; nRMSE and skill charts; five test days; forecast vs actual scatter; error vs clear-sky-index error; error by sky condition |
Sensitivity | Sensitivity table and chart for soiling, mounting, tilt, row pitch, DC/AC ratio and availability |
Economics | LCOE, IRR and payback for three installed costs and three tariffs in your country's currency; cumulative cash flow |
Two details save revision rounds. Every figure title already carries the plant size and site name, so captions need little editing. Every chart note states how the numbers were derived, which you can adapt directly into the methods text.
Ready-to-use outlines
Pick the outline that matches your question, then drop the exported figures into the marked places.
Research paper (design or performance study)
- Introduction: the gap, and the one design question you answer
- Site and system: location, weather source, climate charts, block diagram
- Methodology: modelling-chain figure and model choices (transposition, thermal, shading, inverter)
- Results: monthly results table, energy and PR chart, tilt × azimuth map, row-pitch study
- Sensitivity and economics: sensitivity chart, LCOE/IRR table, cash-flow chart
- Discussion: what the result means for designers, with limits
- Conclusion: the answer to the question in one paragraph, with the key number
Case study
- Project background: owner, purpose, capacity, commissioning
- Site resource: GHI, temperature, wind and sunshine charts
- Plant design: block diagram, module and inverter selection, layout
- Simulated performance: monthly table, daily profiles, loss breakdown
- Financial outcome: payback and IRR at local tariffs
- Lessons learned
Validation study
- Plant and monitoring data: period, data quality, gaps
- Scenarios: S0 blind (generic defaults) and S4 as-built
- Results: recorded vs simulated table, deviation chart, scatter, annual table
- Calibration criteria: nMBE and CV(RMSE) against ASHRAE Guideline 14
- Causes of the remaining deviation
Review or tool-utilisation paper
- Scope: which methods or tools are reviewed and why
- Modelling chain explained step by step, using the chain figure
- Worked example: one project run through the full chain
- Comparison of approaches (for example forecasting models, or blind vs as-built inputs)
- Guidance for users and open research questions
Good practice that gets papers accepted
Speed only helps if the paper survives review. These habits keep a simulation-based paper credible.
- Name your weather source and year. State whether it is a TMY, a measured year or a synthetic year, and its provider. Reviewers reject results built on unnamed weather.
- Say what is simulated and what is measured. In the forecasting figures, "actual" is the simulated plant output; write that in the caption. Never label illustrative recorded values as metered data.
- Report validation metrics, not just a chart. Give annual deviation, monthly nMBE and CV(RMSE), and compare them with a recognised threshold such as ASHRAE Guideline 14.
- Make it reproducible. List module and inverter models, tilt, azimuth, pitch, every loss value and the simulator version. Keep the project file so you can re-run it during revision.
- Keep one source of truth. Re-export figures and tables after any change to the model, so the text, tables and charts never disagree.
- Cite the methods, not only the tool. Reference the transposition, thermal and single-diode models you used, alongside IST PVSolar Simulator.
- Match the journal's format. SVG figures convert to the EPS, PDF or high-resolution TIFF most publishers ask for; CSV tables paste straight into the journal template.
Frequently asked questions
Do I need measured plant data to publish? No. Design studies, case studies, review papers and articles work from simulation alone. Measured data is needed only for a validation study.
Can students use this for a thesis or final-year project? Yes. One project gives enough figures for a results chapter, and the modelling-chain and methodology figures cover the methods chapter.
Will the figures match my project's size and location? Yes. Titles, axis ranges and notes are generated from the project you simulated, including its kWp, site name and currency.
Does the tool write the paper for me? No. It produces the evidence: figures, tables and derivation notes. The argument, interpretation and conclusions are yours, which is what reviewers assess.
Start your next paper today
Run one hourly simulation of a plant you know, open Research ▸ Project Analysis, and export the figures. You will have the skeleton of a results section before the end of the day. Evaluate it with your own project in IST PVSolar Simulator.