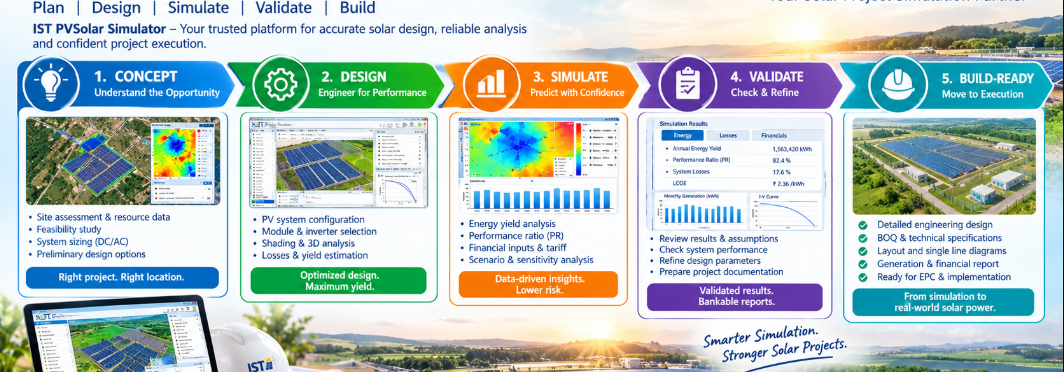
From Concept to Build-Ready Projects using IST PVSolar Simulator
A solar project wins or loses money long before the first module is bolted down. The layout, the energy yield, the wiring and the financial model are all decided at the design stage — and IST PVSolar Simulator brings every one of those decisions into a single workflow, so a project moves from a rough site idea to a build-ready, bankable design without changing tools.

How 3D Layout Supports the Solar Business
A 3D layout turns a site into a sales and engineering asset at the same time. With IST PVSolar Simulator's 3D Shading Model, you upload a satellite image or site plan, trace the roof or land boundary, mark obstacles, and let Auto Fit place modules row by row — then review the result in a live 3D preview.
For a solar business, that changes three things:
- Faster, more convincing proposals. A client sees their own roof or plot with panels on it, not a generic brochure. The 3D preview, row-pitch diagram and sun-path chart go straight into the report.
- Accurate capacity from day one. The layout shows exactly how many modules fit after setbacks, walkways, obstacles and shade-free spacing — so the kWp you quote is the kWp you can build.
- Fewer surprises on site. Rooftop and ground-mount areas can be mixed in one image, and ground-mounted plants are laid out with sub-array blocks, inverter stations, a substation and internal roads, so the design already reflects how the plant will actually be built.
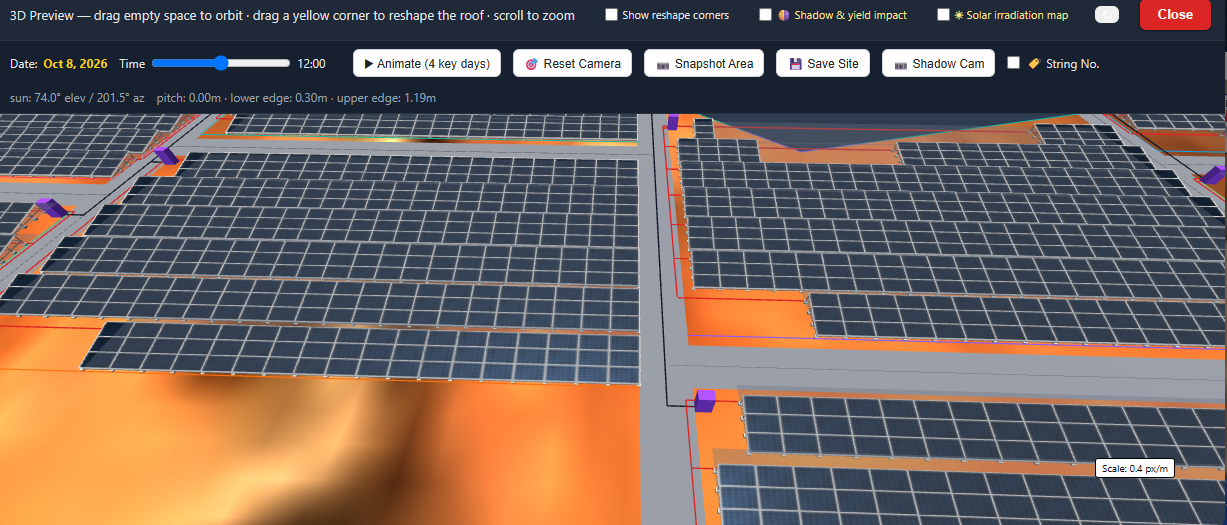
Integrated Engineering-Grade Layout
The layout in IST PVSolar Simulator is not a picture laid over a map — it is an engineering model that the rest of the design reads from.
- Real site geometry. Ground levels can be flat, a uniform slope, imported topographic survey points (CSV, TXT or XYZ in latitude/longitude or easting/northing), or online elevation from the Copernicus GLO-90 model. The layout then accounts for slopes, grading and pile heights.
- Shade-free row spacing. Row pitch is calculated from the project's own latitude for the winter-solstice (21 December) design window, so rows are packed as tightly as possible without shading each other in the hours that matter.
- Object and horizon shading. Shadows from parapets, tanks, trees and neighbouring buildings are modelled in 3D, and far-horizon shading can be added on top. The result is a 12 × 24 shading table that is applied directly to the energy simulation.
- Bifacial-ready. For bifacial modules, rear-side structure shading, transparency, mismatch, clearance and ground albedo are set in the same module geometry, feeding the view-factor rear-irradiance model.
Because one latitude, one module geometry and one string arrangement are shared everywhere, the layout, the shading loss and the simulation never drift apart.
Why Layout Decisions Directly Affect ROI
Every layout choice moves either the cost side or the energy side of the investment — usually both. Small changes at the drawing stage compound over a 25-year project life.
Layout decision | What it changes | Effect on ROI |
|---|---|---|
Tilt and azimuth | Plane-of-array irradiance, structure height and wind load | Higher yield per kWp vs. higher structure cost |
Row pitch | Inter-row shading vs. land or roof use | Tighter rows fit more kWp but lose energy to shading |
Module count and DC/AC ratio | Capacity, inverter clipping, CAPEX | Over-sizing adds energy until clipping erodes the gain |
Obstacle and setback handling | Usable area and shaded modules | Removing shaded panels can raise PR and lower cost per kWh |
Cable routing and home-run length | DC and AC ohmic losses, cable cost | Shorter runs cut both losses and material |
Ground slope and pile heights | Civil works and structure cost | Terrain-aware layouts avoid costly rework |
In IST PVSolar Simulator each of these choices flows straight into the energy simulation and then into the financial model, so you see the effect on payback, IRR and NPV immediately — not after the project is built.
Role of Energy Simulation and Solar Data
A design is only as good as the sunlight data behind it. IST PVSolar Simulator lets you choose the solar resource that matches the project's stage and the lender's expectations:
- NASA POWER monthly climatology and an hourly typical-year (TMY) built from NASA hourly data.
- PVGIS TMY — a true ISO 15927-4 Typical Meteorological Year with measured beam-normal irradiance.
- Your own bankable dataset — Meteonorm, SolarGIS, SolarAnywhere or any other TMY entered manually when the lender or independent engineer has already named one.
Site data can be saved and reused across design variants, so every option is compared on the same weather. On top of the weather, the simulator applies a full, transparent loss chain — soiling, incidence angle (IAM), spectral, thermal, mismatch, light-induced degradation, DC and AC ohmic losses, auxiliary consumption and module ageing — each with recommended default values you can adjust.
The outcome is not a single number but a probability range: P50, P75, P90 and P95 annual energy, which is what banks and investors use to size debt and judge risk.
Electrical System Modeling Within the Layout
In many workflows the electrical design is done separately, on a drawing that may not match the final panel layout. IST PVSolar Simulator builds the electrical system from the layout itself.
- String and sub-array design. Modules per string, strings per MPPT, MPPTs per inverter and the number of inverters are set per sub-array, with live safety checks on string voltage at the coldest and hottest design temperatures and on the inverter loading ratio (DC/AC).
- Wiring diagram from the real layout. After Auto Fit, the wiring diagram maps the strings exactly as they were placed — including uneven strings forced by roof shape or removed shaded panels — through DCDBs and MPPTs to each inverter, with an MPPT string schedule.
- Cables, protection and earthing. Home-run length sizes the string-to-DCDB cables and voltage drop. The Protection & Cable Schedule covers protection devices, while earthing (IS 3043 method) and ESE lightning protection (NF C 17-102:2011) are calculated and carried into the bill of quantities.
- Grid-code checks. Power-factor reserve, ramp-rate limits and LVRT/HVRT ride-through references (CEA/IEGC, IEEE 1547-2018, EN 50549-1) are simulated or documented as part of the design.
- Storage. Battery systems can be added with AC or DC coupling, several dispatch strategies, time-of-day tariffs and battery ageing.
The result: a single-line diagram, string schedule and cable schedule that agree with the layout the client approved.
Integrated Energy Modeling and Simulation
The simulation engine uses the layout, the shading tables and the electrical design together, at the resolution the project needs: monthly for quick what-if checks, hourly (8,760 steps) or 15-minute (35,040 steps) for bankable reports.
At every time step the energy is calculated through a physical chain:
- Exact sun position and Perez transposition to plane-of-array irradiance, including row-to-row and 3D object shading.
- Incidence-angle (Martin-Ruiz IAM) and air-mass spectral corrections to give effective irradiance.
- Cell temperature from the Faiman thermal model.
- Module output from a single-diode (De Soto) I–V model — with two-diode and linear models also available — plus bifacial rear-side gain where relevant.
- DC losses and degradation, then the inverter efficiency curve and true clipping at the AC rating.
Results include DC capacity, annual AC energy, performance ratio, specific yield, monthly tables, P50–P95 probability curves, a 25-year generation forecast and CO₂ savings. For deeper work, the Research tab adds IEC 61724-1 yield and loss accounting, tornado sensitivity analysis, and P50/P90 uncertainty from six separate sources. Module and inverter data can come from .PAN / .OND files, datasheet PDFs or manual entry.
Financial and Performance Optimization
The best design is not the one with the highest kWh — it is the one with the best return for the risk. IST PVSolar Simulator puts the financial model next to the engineering, so both are optimized together.
- Country-aware economics. CAPEX, OPEX, tariff and revenue are modelled in the project's own currency, with country-specific tax and depreciation (WDV, straight-line or custom schedules), grid export rules such as net metering or feed-in tariffs, and local CO₂ grid factors. Region-specific CAPEX-per-Wp bands flag costs that look unrealistic for the market.
- Project and equity views. A project-level model gives NPV, IRR, LCOE and payback; an equity-level model with financing shows what the investor and the lender actually see.
- Risk, not just averages. The hourly energy profile is combined with Monte-Carlo analysis of yield uncertainty, degradation, tariff and O&M escalation, producing a due-diligence view ready for a lender's independent engineer.
- Batch optimization. Design variants — tilt, module, inverter, DC/AC ratio and more — can be queued and run as a batch. Each run logs energy, clipping, PR, specific yield, CAPEX and income side by side, and an AI-assisted step suggests the best configuration by weighing yield, financial and bankability results together.
Instead of guessing which option pays back fastest, you compare them on the same data and present a defensible recommendation.
A Unified Platform Instead of Fragmented Tools
A typical solar project still passes through a layout tool, a yield tool, a spreadsheet for strings and cables, another for finance, and a word processor for the report. Every hand-off is a chance for numbers to drift.
Fragmented tools | IST PVSolar Simulator | |
|---|---|---|
Layout to yield | Re-enter module counts and shading by hand | Layout and 3D shading feed the simulation directly |
Electrical design | Separate drawing, may not match the layout | Wiring diagram built from the as-placed strings |
Financial model | Spreadsheet copied from the yield report | Economics run on the simulated energy profile |
Design changes | Update every file again | Change once; results, drawings and reports follow |
Deliverables | Assembled manually from several sources | EPC proposal, BOQ and Draft DPR generated from one design |
The workflow from concept to build-ready runs in one place:
- Project and site — location, solar resource and horizon.
- Orientation and system — tilt, azimuth, modules, inverters and losses.
- 3D layout and shading — trace, Auto Fit, terrain and shade analysis.
- Sub-arrays and electrical — strings, MPPTs, cables, protection and earthing.
- Simulation — hourly or 15-minute energy with P50–P95.
- Economics and bankability — CAPEX, financing, NPV, IRR and risk.
- Deliverables — EPC proposal, bill of quantities and a lender-style Draft DPR in Word, with the SLD, loss diagram and charts embedded.
One design is the single source of truth for the technical simulation, the bankability report and the commercial proposal.
From Concept to Build-Ready
A build-ready project is one where the layout, the energy forecast, the electrical design and the business case all tell the same story. IST PVSolar Simulator gets you there by keeping every step connected: the panels you place drive the shading, the strings you wire drive the losses, and the energy you simulate drives the returns your client and lender rely on.
Whether you are an EPC contractor quoting a rooftop, a developer screening a utility-scale site, or a consultant preparing a bankability report, the result is the same — fewer tools, fewer errors and a design you can build with confidence.
Start your next project in IST PVSolar Simulator and take it from first site idea to a build-ready, bankable design in one place.