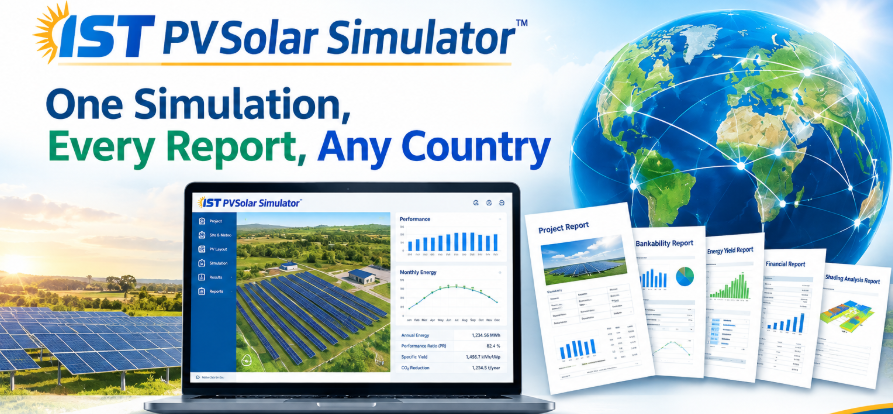
IST PVSolar Simulator: One Simulation, Every Report, Any Country
Why one platform matters
Most solar projects still move through a patchwork of tools. Engineers model the energy in one program, rebuild the finances in a spreadsheet, draw the single-line diagram in CAD and type the feasibility report in Word. Every hand-off is a chance for a number to drift, and every design change means updating four files.
IST PVSolar Simulator removes those hand-offs. You describe the site and the system once, run one simulation, and every report, drawing and financial model is generated from that same result. Change the module or the tariff, run again, and everything updates together.
What IST PVSolar Simulator is
IST PVSolar Simulator is a web-based platform for designing, simulating and financing grid-connected solar PV plants, from a 5 kW rooftop to a utility-scale ground-mounted plant. It runs in the browser, so there is nothing to install and projects can be opened from any computer.
It follows international methods throughout: IEC 61724-1 performance accounting, IEC 61853 module rating, a single-diode (De Soto) cell model, Perez sky transposition and IEC 60364-7-712 for PV electrical design. On top of that engineering core sit the economics, the bankability analysis and the report generators, all reading from the same simulation.
Built for every country
Pick a country and the whole project adapts: currency, tax, tariff, standards, utility names and the rules for exporting solar to the grid. The Country / Market list covers 125 countries across South Asia, Southeast Asia, Africa and Europe, plus the USA, UAE, Saudi Arabia and Australia.
What changes with the country | Example |
|---|---|
Currency and number format | ₹ lakh/crore in India, KSh in Kenya, RM in Malaysia |
VAT / GST on equipment | 16% in Kenya, 18% in Sri Lanka, 7% in Thailand |
Tariff, escalation and discount rate | Typical local defaults, all editable |
Grid export credit | Net metering in Kenya (up to 10 kW), net billing in Nigeria (0.55 × tariff), no export credit in Indonesia, Solar ATAP in Malaysia |
Tax and depreciation preset | Section 12B in South Africa, 40% WDV in India, 20-year effective life in Australia |
Standards and utility wording | DISCOM and CEA in India, Kenya Power and KS IEC in Kenya, PLN and PUIL in Indonesia |
The weather data works everywhere too. Import a typical year from PVGIS or NASA POWER in one click, or upload your own hourly file from Solargis, Meteonorm, Solcast, NSRDB, PVsyst or an EPW. The simulator reads the time zone, aligns it to solar time and makes it the solar resource for the run.
Country rules change, so administrators can update any country's tariff, VAT, export rule or tax preset from the admin panel, with the date and source shown to users.
One simulation run, every output
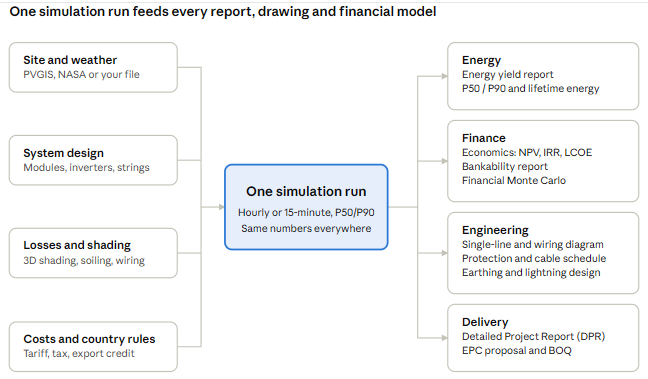
Everything on the right is generated from the same run, so a change to the design or the tariff updates every document at once. There is no re-typing of yields into spreadsheets and no copying numbers into Word.
Engineering depth behind the single run
The energy engine simulates the plant hour by hour (or every 15 minutes) across a full year, then over the project life with degradation. Each step carries the full chain from sunlight to grid meter.
- Solar resource: PVGIS and NASA POWER typical years, manual monthly data, or your own hourly weather file.
- Plane-of-array irradiance: Perez transposition, incidence-angle losses, far-horizon shading and site-condition allowances.
- 3D shading: draw roofs or ground arrays on a site image, check row pitch against the sun path and see the shading heatmap.
- Bifacial and trackers: rear-side irradiance from an unlimited-sheds 2D model, and single-axis tracker simulation.
- Module and inverter behaviour: single-diode cell model, thermal model, IV curves, mismatch, LID, spectral and soiling losses, inverter efficiency and clipping.
- Storage: day and night load tally, battery sizing, dispatch, bill savings and battery lifetime economics.
- Uncertainty: six uncertainty sources combined into P50, P75, P90 and P95 yields, with Monte Carlo on both energy and finance.
PV module and inverter databases are built in, and PAN/OND files or datasheets can be imported. A Research tab adds sensitivity (tornado) analysis, SCADA benchmarking and IEC 61724 loss accounting for studies and publications.
Economics and bankability, from the same numbers
The financial model takes the simulated P90 energy directly, so the economics can never drift from the engineering.
- Project returns: NPV, project and equity IRR, LCOE, simple and discounted payback, break-even tariff and a 25-year cash flow.
- Costs: a CAPEX table with VAT/GST per item and input-tax credit, an OPEX table with escalation, subsidies and grants.
- Tax: corporate tax, declining-balance, straight-line or custom depreciation, tax holidays, with a one-click preset per country.
- Grid export credit: the share of solar used on site versus exported, valued under the country's net-metering, net-billing, feed-in or no-export rule.
- Debt: loan sizing, EMI, DSCR by year, DSRA and lender covenant checks.
- Risk: a financial Monte Carlo that turns energy uncertainty into a spread of NPV, IRR and DSCR outcomes.
The Bankability Report gathers all of this into the format a lender's engineer expects. It covers resource quality, P50/P90 yields, CAPEX per Wp against country benchmark bands, DSCR, risk grading and a due-diligence checklist.
Who it is for
User | What they get from one run |
|---|---|
EPC contractors and installers | A quotation, BOQ, cable schedule, wiring diagram and earthing design, ready to send |
Project developers | Yield, returns and a DPR for investors and approvals, in local currency and rules |
Consultants and lender's engineers | P50/P90 yields, uncertainty, DSCR and a bankability report to review |
Utilities, C&I buyers and investors | A clear view of self-consumption, export credit and payback before signing |
Students and researchers | Sensitivity, uncertainty, SCADA benchmarking and publication-ready charts |
From site to DPR in seven steps
- Project and site: choose the country, enter the location and import a weather year (PVGIS, NASA or your own file).
- Orientation: set tilt and azimuth, or let the tools suggest the best orientation and row pitch.
- System design: select modules and inverters, then build sub-arrays with live string-voltage safety checks.
- Losses: confirm soiling, wiring, mismatch, degradation and other losses, with recommended values for each.
- Economics: enter CAPEX, OPEX, financing, the export-credit rule and the tax preset.
- Run the simulation: one hourly or sub-hourly run produces the yield, PR, losses, P50/P90 and lifetime energy.
- Generate: open the reports, drawings, schedules and DPR, all filled from that run.
Design once, deliver everything
A solar project is one plant, so it should be one model. With IST PVSolar Simulator the yield, the money and the paperwork come from the same run, in the currency, standards and rules of the country you are building in.
Start your next project at istpvsolarsimulator.com: set the country, import the weather, run once, and send the client, the lender and the utility everything they need.