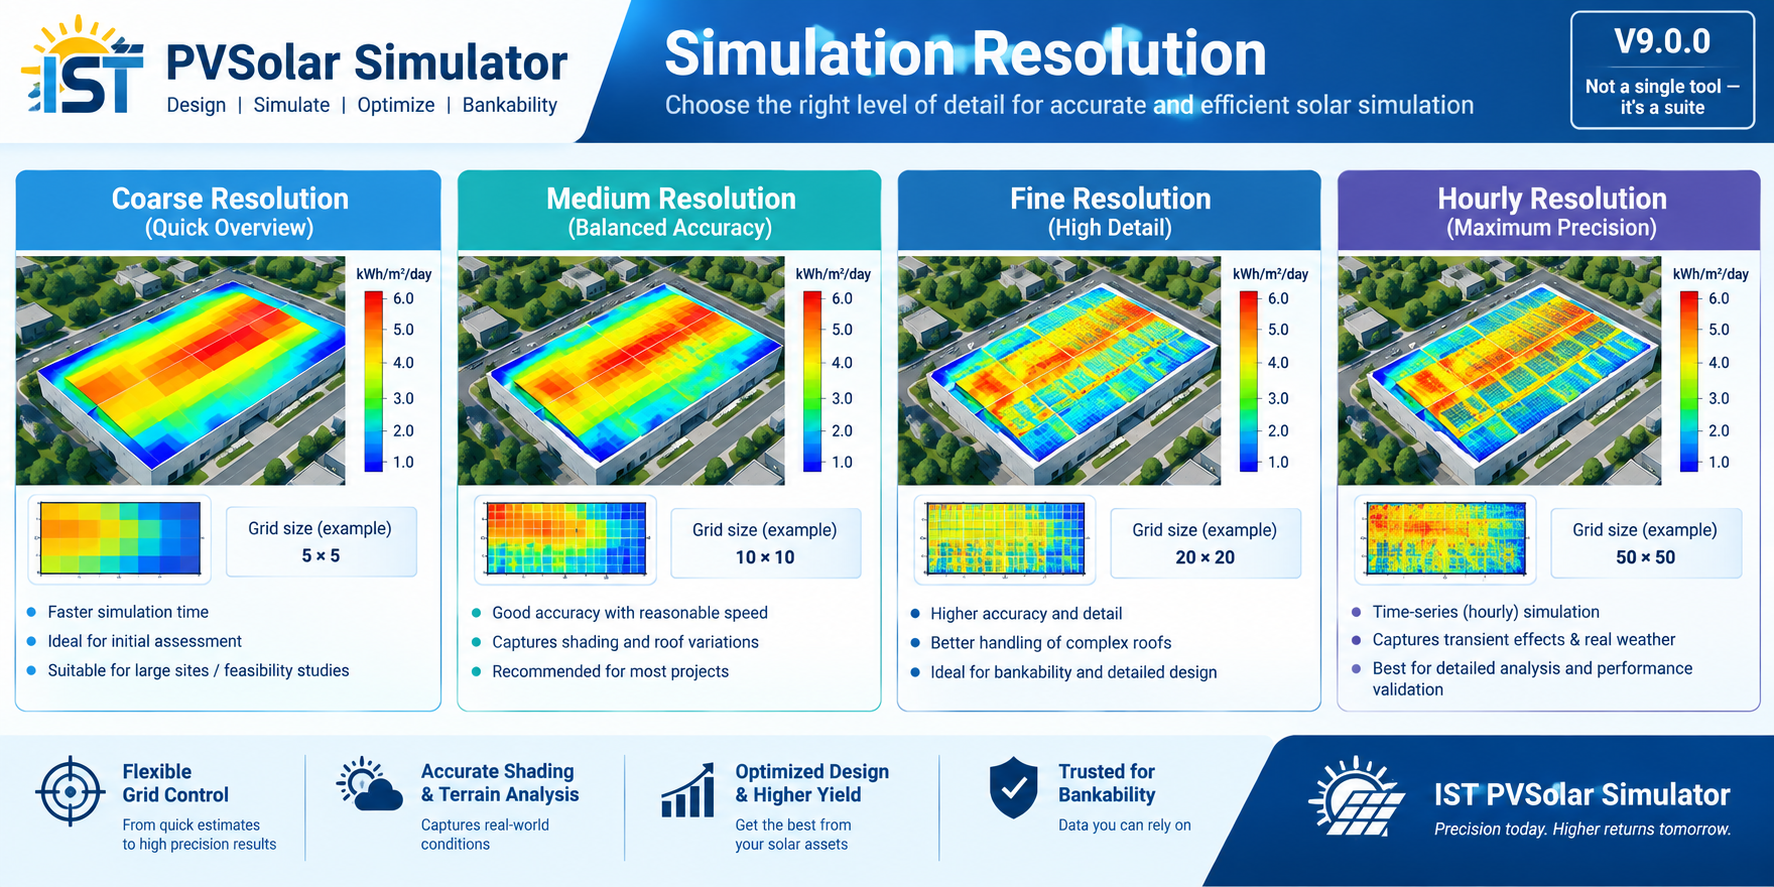
Simulation Resolution in IST PVSolar Simulator: Why Time-Step Matters for Bankable Energy Yield
Ask any two solar simulation tools to estimate a plant's annual energy yield, and you'll often get answers that differ by 3–5% — not because the physics is different, but because of when the physics is applied. This is the core idea behind Simulation Resolution, a design choice that sits quietly behind every energy yield number a PV simulator produces, and one that IST PVSolar Simulator puts directly in the engineer's hands.
What "Simulation Resolution" Actually Means
Every PV simulation ultimately solves the same equation repeatedly: given the irradiance, temperature, and system configuration at a moment in time, how much AC energy comes out? The question is how often that moment is sampled across a year.
IST PVSolar Simulator (Simulation Engine) offers three resolution modes:
- Monthly — the system is evaluated once per calendar month using averaged conditions. Fast, but blind to anything that happens within a day or a week.
- Hourly (8,760 steps/year) — the system is evaluated for every hour of the year, using real or TMY-derived weather.
- Sub-hourly (35,040 steps/year) — a 15-minute time-step, four evaluations per hour.
Each step up in resolution isn't just "more numbers" — it changes which physical effects the simulation can even see.
Why Monthly Averaging Hides Real Losses
A monthly-average simulation asks: "What's the typical irradiance and temperature this month, and what does the plant produce under that average condition?" The problem is that solar plants are highly non-linear — inverter clipping, electrical shading, and low-irradiance efficiency droop all depend on the shape of the irradiance curve within a day, not just its monthly total.
Consider two identical arrays feeding an inverter that's oversized for its rated AC capacity (a common, deliberate design choice — see the ILR discussion below). At monthly resolution, if the average power is below the inverter's rating, the model reports zero clipping loss. But on a clear midday hour, the array's instantaneous DC output can spike well above the average and get clipped at the inverter's ceiling — a real loss that simply doesn't exist in a monthly-average world. Sub-hourly clipping loss is one of the loss line items IST's engine reports specifically because it only becomes visible once you resolve intra-day irradiance peaks.
What Hourly and Sub-Hourly Resolution Unlocks
Running the engine at Hourly or Sub-hourly resolution activates a cascade of physical effects that a monthly model cannot represent:
1. Real clipping behavior. Every 15-minute (or hourly) DC output is compared against the inverter's actual power curve, so clipping loss is computed from genuine peak conditions rather than inferred from averages.
2. Cell-temperature-driven thermal loss. The IEC 61724-1 Uc/Uv thermal model computes cell temperature at every time-step from ambient temperature, irradiance, and wind speed — capturing the fact that a module in Rajasthan at 2 PM in May behaves very differently from the same module at 9 AM in December, even if their monthly averages look similar.
3. Electrical (bypass-diode) shading. Row-to-row shading changes minute by minute as the sun moves. IST's bypass-diode I-V model needs a real, resolved irradiance and geometry sequence to trace how a shaded substring drags down string output — this simply cannot run meaningfully on monthly averages, which is why the simulator auto-upgrades resolution to Hourly whenever electrical shading is engaged.
4. Grid-code compliance dynamics. Ramp-rate limiting (how fast a plant is allowed to increase output after a cloud passes) and reactive-power/power-factor reserve derates are inherently time-domain phenomena — they only exist at Hourly or Sub-hourly resolution.
5. Inverter Euro-weighted efficiency curve. Rather than applying one flat efficiency number, the simulation walks the inverter's efficiency-vs-loading curve at each time-step, since inverters are markedly less efficient at 10% loading than at 50–100%.
The Weather Data Behind the Numbers
Resolution is only as trustworthy as the weather feeding it. IST PVSolar Simulator lets an engineer import genuine hourly resource data rather than relying on synthesized profiles:
PVGIS TMY — a true ISO 15927-4 Typical Meteorological Year built from measured DNI (via SARAH2/ERA5), which preserves real weather sequences — cloud transients, morning fog, monsoon breaks — rather than smoothing them away.
The report a year-to-year GHI variability (%), computed as the coefficient of variation across the historical years sampled — a number that can be fed straight into the plant's uncertainty budget rather than guessed at.
From Energy Estimate to Bankable Number: P50 Through P95
A single "annual energy" figure is not what a lender wants to see. IST PVSolar Simulator's engine propagates uncertainty through the full simulation to produce an exceedance probability distribution.
From this combined uncertainty, the simulator reports P10, P50, P75, P90, and P95 energy figures — each aimed at a different audience: P50 for developers and EPCs sizing the plant, P90 for the banks and lenders who need a conservative, high-confidence number to underwrite debt service, and P95 for insurers and rating agencies wanting an even more conservative floor. A Monte-Carlo engine layered on top of this further stress-tests project NPV, IRR, LCOE, and Debt Service Coverage Ratio across thousands of trials, each drawing its own weather and technical-uncertainty samples.
None of this is meaningful without resolution-appropriate time-series data underneath it — a P90 number computed from a monthly-average simulation is arguably no more trustworthy than a coin flip, since the loss mechanisms that actually erode energy (clipping, thermal droop, shading) haven't been modeled at all.
Practical Guidance: When to Use Which Resolution
| Use case | Recommended resolution |
|---|---|
| Quick concept-stage sizing, ILR sanity check | Monthly |
| Any report shown to a lender, investor, or DISCOM | Hourly or Sub-hourly |
| System has row-to-row shading enabled | Hourly (auto-enforced) |
| Grid-code ramp-rate / reactive power studies | Hourly or Sub-hourly |
| Fine inverter-clipping optimization, ILR tuning | Sub-hourly |
| Bankability report / financial close package | Hourly minimum, with a full P10–P95 uncertainty budget |
Conclusion
"Simulation resolution" sounds like a technical footnote, but it's really a statement about what the simulation is allowed to know. A monthly model can only ever answer "roughly how much sun fell on this array this month." An hourly or sub-hourly model, fed by a genuine TMY dataset, can answer the much harder — and much more useful — question: "given the real shape of a Tuesday afternoon in July, how much of that energy actually reaches the grid, after clipping, heat, shading, and grid-code limits take their share?"
That second question is the one financiers, EPCs, and asset owners actually need answered — which is why IST PVSolar Simulator treats resolution not as a performance knob, but as the foundation of a trustworthy energy yield estimate.