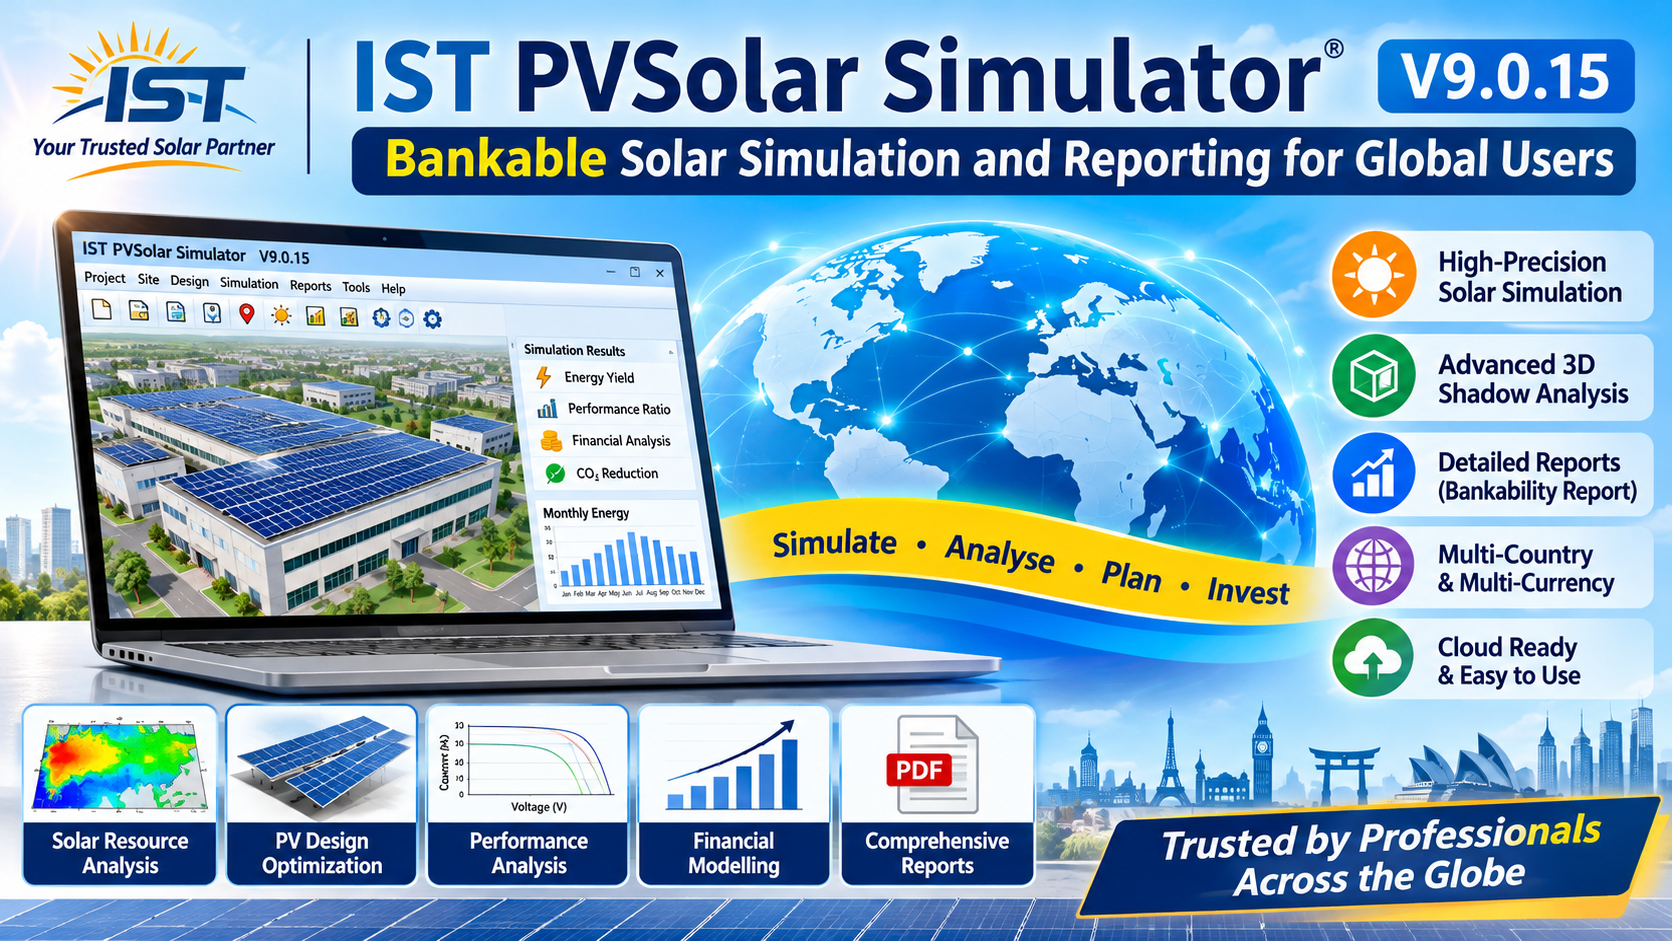
IST PVSolar Simulator: Bankable Solar Simulation and Reporting for Global Users
IST PVSolar Simulator (version 9.0.15, updated 7 November 2026) takes a solar project from site and weather data to a lender-ready report set in one web application. It covers rooftop, commercial and industrial, captive, net-metering and utility-scale plants, from a few kilowatts to gigawatt portfolios.
Most teams today stitch together three or four tools: one for energy yield, one for layout, a spreadsheet for finance and a word processor for the project report. IST does all four in one place, so the numbers in the report are the numbers the engine calculated. It runs in the browser, works in 11 languages and handles local currencies and tariff rules.
Simulation: from weather data to every hour of plant output
IST simulates a plant hour by hour for the full year (8,760 steps), or at 15-minute resolution, using the Perez transposition model. Every result can be traced back to its weather source and its loss chain.
Weather and site data
- PVGIS TMY, NASA POWER hourly TMY, or your own weather file: Excel, CSV, EPW, TM3, MET or JSON exports from NSRDB, Solargis, Solcast, Meteonorm and others.
- A manual monthly weather table for sites with only monthly data.
- A side-by-side benchmark of the default, PVGIS and NASA sources for the same site, so the choice of weather source is a documented decision.
Design and shading
- Multiple sub-arrays with their own modules, inverters, tilt, azimuth and mounting.
- A 3D shading model with roof faces, shadow-free pitch design and far-horizon shading.
- Electrical shading through reverse I-V and bypass-diode modelling, not just a flat percentage.
- Bifacial rear irradiance (Perez diffuse plus view factor), single-axis trackers, terrain-following trackers and battery storage dispatch.
Loss accounting
- A full loss chain: irradiance corrected for IAM, shading and spectrum, then temperature, LID, mismatch, soiling, wiring, clipping and degradation.
- IEC 61724-1 yield and loss accounting, with P50, P75, P90 and P95 exceedance values.
- Sub-array-wise DC losses and string design checks, so a weak block is visible before construction.
Kilowatt to Gigawatt scale
IST is built for small to very large plants. A 1 GW layout with 1.6 million modules simulates in about 1.3 seconds using about 54 MB of server memory. Identical blocks are simulated once, and a per-sub-array breakdown is still produced.
Financial engine: validated, not just calculated
IST's financial engine is built and tested separately from the user interface. Every KPI it reports is reconciled against the annual cash flows, the debt schedule and the tax calculation, on every run.
Revenue that matches how the plant is paid
- Four project models: utility-scale PPA, industrial captive, commercial rooftop and net-metering.
- Two separate tariffs: the electricity (export) tariff and the self-consumption tariff are never merged. Export revenue and self-consumption savings stay separate in every year of the cash flow.
- Self-consumption entered as a percentage of generation or as a fixed kWh per year, capped by generation.
- Net-metering settlement rules: export credit, banking charge, monthly or annual settlement and net-surplus compensation.
Lender metrics
- Project and equity IRR, NPV, LCOE, payback and discounted payback.
- DSCR, LLCR and PLCR on cash flow available for debt service, with lender-specific covenant thresholds.
- Tax-loss carry-forward, WDV or straight-line depreciation, subsidies, grants and mixed debt and equity financing.
Validation
Each run passes 19 reconciliation checks on the economics and 13 on the bankability metrics. A suite of 15 reference cases (409 checks) compares the engine with a separate first-principles model that shares no code with it. Results are shown in the app, so a reviewer can see the proof before using a figure.
Reports: one project, every document a project needs
IST turns a single simulation into the full document set that clients, lenders and approving authorities ask for. Every report draws from the same results, so figures agree across documents.
Report | What it contains | Who uses it |
|---|---|---|
Simulation Report | System design, loss diagram, monthly results, P50 to P95, and a 25 to 40-year energy and revenue projection that fits the page width | Clients, EPC engineers |
Bankability Report | Lender metrics, covenant tests, reconciliation proof, risk inputs and data provenance | Banks, NBFCs, independent engineers |
Draft DPR (Word .doc) | A full Detailed Project Report draft: technical, financial, implementation and environmental sections | Approving authorities, investors |
Financial Due Diligence | Grid and permitting status, technology assessment, legal, insurance, country risk and fiscal inputs | Lenders, investment committees |
Financial Risk Assessment | Hourly 8,760-step profile, Monte Carlo P50/P90 on IRR and DSCR, and a risk tornado for equity IRR | Lenders, risk teams |
Proposal, BOQ and Schedule cards | Client proposal, bill of quantities and implementation timeline | Sales, procurement, project managers |
Research Analysis | Per-design diagnostics, sensitivity, SCADA benchmarking and model comparisons | Engineers, researchers |
Hourly results export to CSV with all 55 hourly series. Projects save as .pro files that carry the version in the file name. Files from older versions open in the current format, and the original is never overwritten.
Why global users choose IST PVSolar Simulator
Users choose IST because it replaces a chain of tools with one engine and one set of numbers, from the first yield estimate to the lender's file.
- One workflow instead of four tools. Yield, layout, shading, finance and reports live in one project. There is no re-typing between a yield tool, a spreadsheet and a report template, and no risk of the report disagreeing with the model.
- Finance that proves itself. Most design tools stop at energy or give a simple payback. IST reconciles every KPI with the cash flows, debt and tax on every run and shows the proof.
- Built for local markets. Two separate tariffs, four project models, net-metering settlement rules, local currencies and 11 interface languages, including Hindi, Tamil, Bengali, Arabic, French, Spanish, Portuguese, Swahili, Hausa and Amharic.
- Gigawatt speed in a browser. A 1 GW plant simulates in about 1.3 seconds, with nothing to install.
- Research depth. Bifacial, tracker, soiling, degradation, spectral, temperature-model and battery studies, plus SCADA benchmarking against measured plant data.
- Safe project files. Files carry their version, older files upgrade on open, and originals stay readable by older versions.
Use case | IST rank | IST score | Leader |
|---|---|---|---|
India EPC: financial model, DPR and due diligence | 1 of 14 | 86.5 | IST |
C&I rooftop design and engineering | 1 of 11 | 83.0 | IST |
Conclusion
IST PVSolar Simulator gives solar developers, EPC contractors, consultants and lenders one place to simulate a plant, prove its finances and produce every report the project needs. It is strongest where a project must go from design to a bankable file fast, with local tariffs and rules handled correctly.
To see it on your own site, create a project, import a TMY data, add your sub-arrays and run the simulation. The Simulation Report, Bankability Report and Draft DPR follow from the same run.