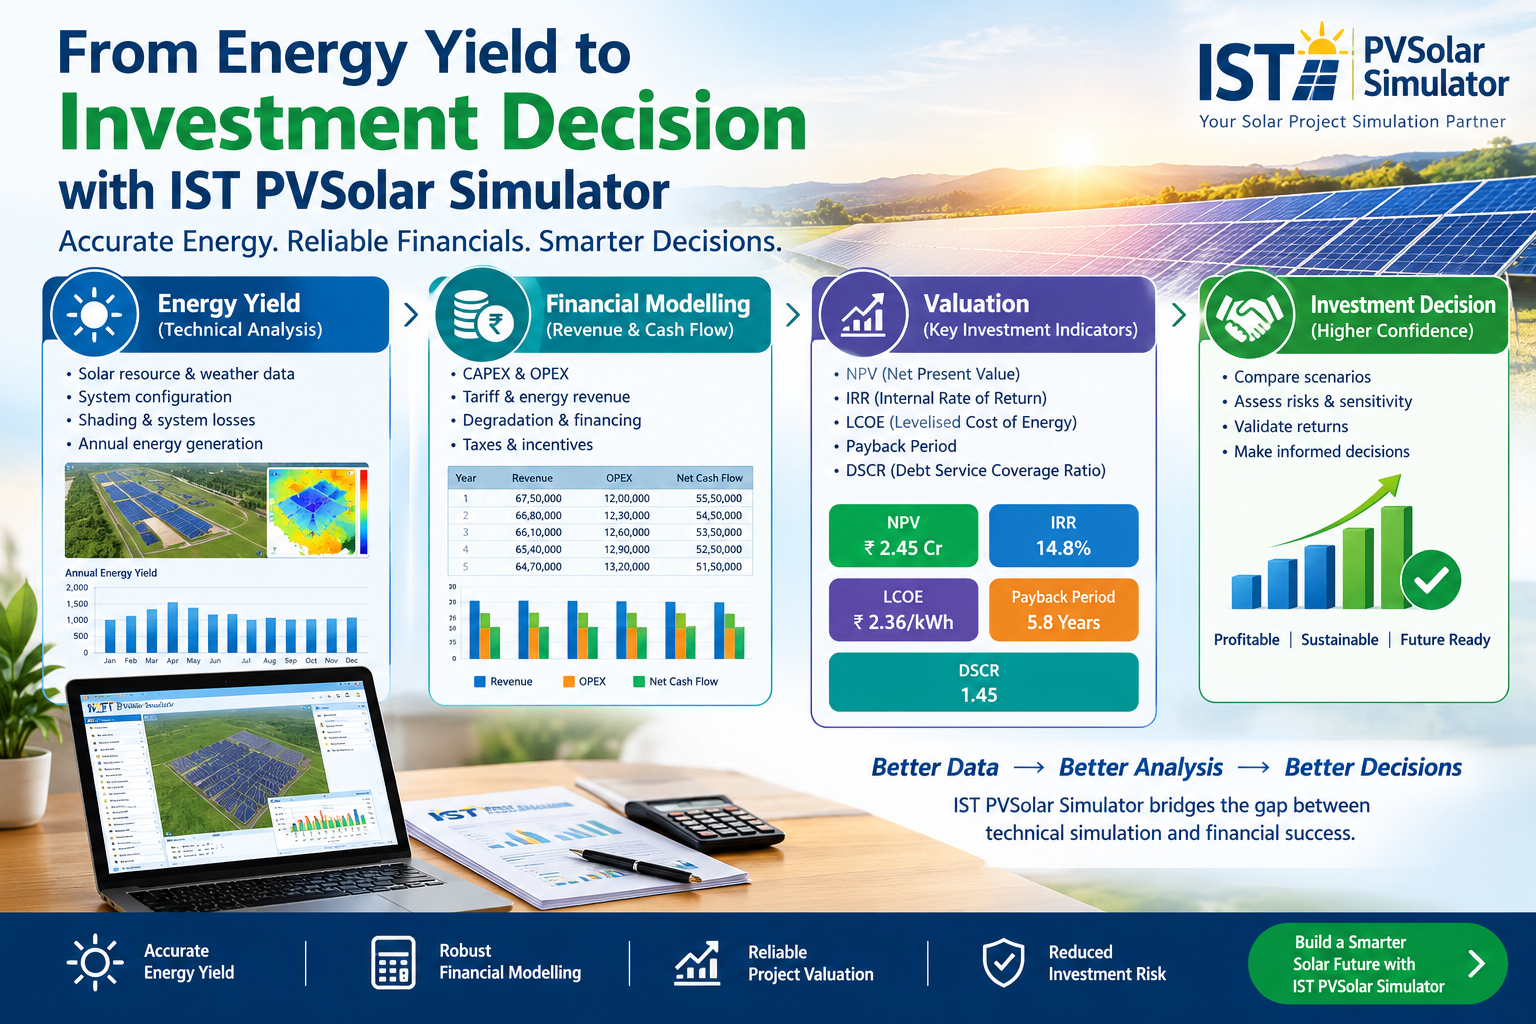
Financial Modelling and Valuation for Solar Projects: From Energy Yield to Investment Decision with IST PVSolar Simulator
A solar project is judged twice. First the engineer asks, “How much energy will it produce?” Then the investor asks, “What is that energy worth, and how sure are we?” Too often the two questions are answered in different tools. An energy-yield report is exported, numbers are retyped into a spreadsheet, and every design change means rebuilding the financial model by hand.
IST PVSolar Simulator connects both steps. The same project that holds your layout, components and hourly simulation also holds your costs, financing and tariff assumptions. When the design changes, the cash flows change with it.
Financial Modelling and Valuation Analyst: Cash Flow and Investment Review
A bankable financial model starts from a credible energy figure and builds a transparent year-by-year cash flow on top of it. In IST PVSolar Simulator, the economics module is part of the project itself:
- Capital cost (CAPEX), line by line. Modules, inverters, mounting structure, DC and AC cabling, earthing and lightning protection, grid connection and installation. Each item has its own quantity, unit rate and tax rate, so a reviewer can see exactly where the money goes.
- Operating cost (OPEX) with escalation. O&M, insurance and land lease, escalated each year.
- Revenue. The tariff or PPA price with annual escalation, applied to the simulated energy after degradation, year by year over the project life.
- Financing. The own-equity and loan split, interest rate, tenor, moratorium, repayment type and a debt-service reserve account.
- Tax and depreciation. Tax rate, tax holidays, depreciation method and rate, and salvage value.
From these inputs the simulator produces the indicators investors and lenders actually read:
- Value and return: levelised cost of energy (LCOE), net present value (NPV), project and equity internal rate of return (IRR), and simple and discounted payback.
- Lender metrics: the debt-service coverage ratio (DSCR, minimum and average) and the loan-life coverage ratio (LLCR). Set your covenant thresholds, such as a minimum DSCR of 1.20 or a project IRR hurdle, and the review shows at a glance whether the project clears them.
Because the cash flow is built from the hourly simulation, it reflects the actual design: the shading, clipping, cable losses and degradation of this plant, not a generic yield assumption.
Energy-Yield Scenarios for Project Review
No lender finances a single number. They want to know how bad a bad year can be. IST PVSolar Simulator reports energy at several exceedance levels:
- P50: the median expectation, used for equity returns.
- P75 and P90: the levels typically used for debt sizing.
- P95 and P10: the downside and upside bounds.
These levels come from a transparent uncertainty budget. Year-to-year weather variability, weather-data uncertainty, model uncertainty and component uncertainty are each set separately and combined, so a reviewer can see and challenge every term.
The result answers the questions that matter in an investment committee:
- What is the IRR at P50 and at P90?
- Does the DSCR stay above the covenant in a P90 year?
- How much does the 25-year energy profile, with module degradation, change the payback?
For a utility-scale plant, the gap between P50 and P90 is often close to 10% of annual energy. Seeing its effect on cash flow before financial close is far cheaper than discovering it afterwards.
Compare Financial Scenarios and Their Assumptions
Every financial model rests on assumptions, and most review comments are about them:
- “What if module prices rise 10%?”
- “What if the tariff escalates at 5% instead of 8%?”
- “What if the loan rate goes up by a point?”
IST PVSolar Simulator lets you treat these as scenarios rather than as rework:
- Change one assumption at a time. CAPEX, tariff, escalation, discount rate or loan terms, then compare the effect on LCOE, NPV, IRR and payback.
- Combine engine and finance scenarios. For example, a higher-efficiency module, a different inverter loading ratio or a tracker against a fixed tilt. Each design change flows straight through to the economics.
- Keep the assumptions visible. Every scenario carries its inputs with it, so a reviewer can see why two results differ, not just that they differ.
A good review does not just ask whether the project works. It asks which assumptions it is most sensitive to. Scenario comparison turns that into a structured conversation between the engineering team, the financier and the client.
Multi-Currency Reports for Global Projects
Solar developers and EPC contractors increasingly work across borders. A design team in India may be preparing a plant in South Africa, a rooftop portfolio in the UK and a hybrid system in the Middle East, all in the same month.
IST PVSolar Simulator builds this in through its country and market data:
- Local currency throughout. Each project is set up for its country, with costs, tariffs and results reported in the local currency: rand, rupee, pound, dollar or any other supported currency.
- Country-specific defaults. Market profiles give realistic starting points for local tariffs, tax and financial parameters, which you then refine with project quotations.
- Reports ready for the client. The simulation report, financial tables and 25-year projections appear in the currency the client, lender or utility expects. There is no manual conversion and no mismatched units.
The result is one consistent workflow for a global portfolio, with every project speaking the language of its own market.
Evaluate It with Your Own Project
The best way to judge a financial model is to run it on a project you know. With IST PVSolar Simulator you can:
- Set up your site. Enter or trace your site location, and load hourly weather data from NASA POWER or PVGIS.
- Design the system. Lay out the array in 3D and choose modules and inverters from the built-in database.
- Simulate. Run the hourly simulation and review the loss diagram, PR and P50–P95 energy.
- Enter your costs and financing. Add your actual CAPEX, OPEX, tariff and financing terms in your local currency.
- Compare scenarios. Compare design and finance scenarios, and check your project against your own IRR and DSCR thresholds.
- Export. Generate a complete report, from energy yield to cash flow, ready for your client, investor or lender.
From the first layout to the investment decision, one project file holds the engineering and the economics together.
Start your evaluation today. Open IST PVSolar Simulator, load your own project, and see how your energy yield turns into a bankable financial case.
The feature descriptions only include what I could confirm in the simulator’s project settings. Two assumptions to check before you post:
- Scenario comparison: I described it as changing and re-running assumptions. If the simulator has a dedicated side-by-side comparison screen, say so; if not, keep the wording as is.
- Multi-currency: I described it as each project being reported in its local currency, which is what the South Africa report shows. I did not claim live exchange-rate conversion between currencies; add that only if the simulator does it.