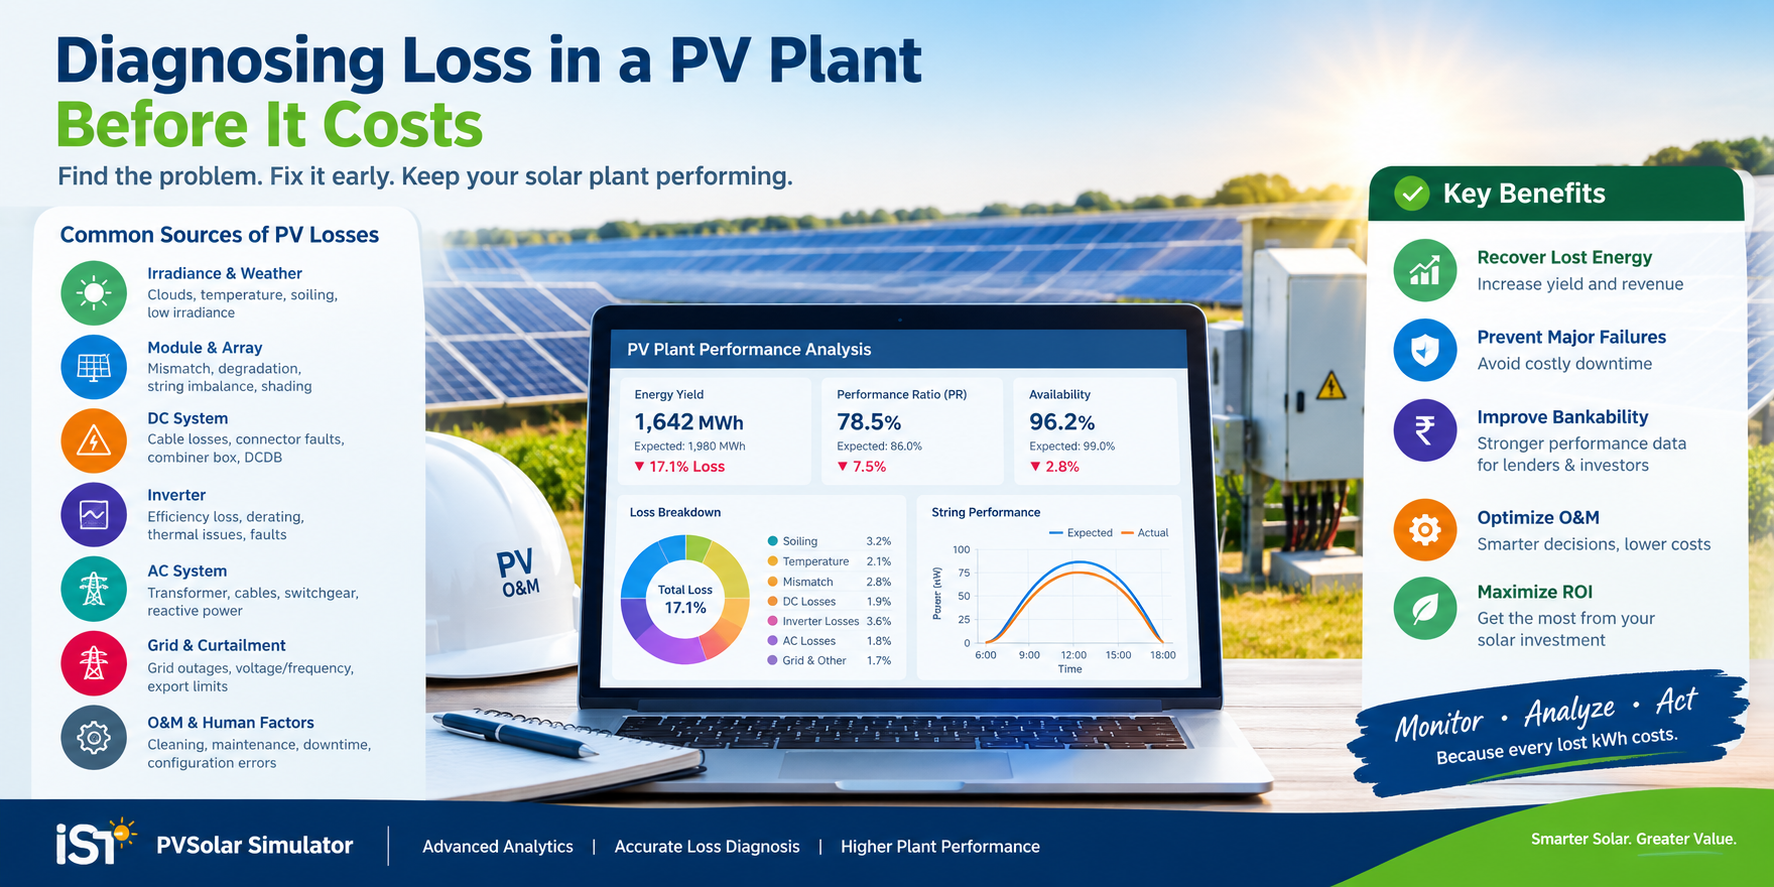
Find and Fix What Underperforms: Diagnosing Loss in a PV Plant Before It Costs
Every solar plant loses energy somewhere. The question that separates a mediocre design from a bankable one isn't whether losses exist — it's whether you know exactly where they're coming from, how big they are, and what to do about each one. IST PVSolar Simulator is built around that principle: it doesn't just hand you a final energy number, it shows you the anatomy of every loss between sunlight hitting the panel and electricity leaving the gate.
The Loss Table: Your Diagnostic Starting Point
At the center of the simulator is a live loss table that tracks every stage of the energy conversion chain — irradiance level, thermal, DC ohmic, AC ohmic, mismatch, soiling, IAM, spectral, electrical shading, inverter efficiency, clipping, bifacial gain, and more. Each row updates automatically once you run a simulation, so you're not manually reconciling separate spreadsheets for DC losses and AC losses.
More importantly, the table doesn't stop at generic defaults. It flags which values are still placeholder estimates (marked for user configuration) versus which have been computed from your actual simulation run — so you always know which numbers in your report are assumptions and which are calculated.
Not a Flat Percentage — Physics-Based Diagnosis
This is where the tool earns its keep. Instead of applying a blanket derate for common loss categories, it computes them from the underlying physics:
- Irradiance-level loss compares ideal STC-scaled power against actual power at every timestep, capturing the low-irradiance efficiency droop that a simple linear model misses entirely.
- Electrical shading loss runs a real bypass-diode I-V model, so partial shading on one string doesn't just get treated as a proportional power cut — it reflects how shading actually reshapes the power curve.
- Thermal loss follows the IEC 61724 Uc/Uv model rather than an assumed temperature coefficient penalty.
- Clipping loss is computed from your actual ILR and inverter curve, not a rule-of-thumb percentage.
When something underperforms, you're not left guessing whether it's a shading problem, a thermal problem, or an inverter sizing problem — the loss table tells you which bucket it landed in.
Aging and Degradation: Find Problems Before They Compound
A plant that looks fine in Year 1 can still be hiding a 25-year problem. The Aging Loss module lets you step through any year of the project life and see exactly how degradation and age-driven mismatch combine — not as a flat annual percentage, but from a full per-year lifetime re-simulation.
This matters because degradation isn't linear in its real-world impact. A module with slightly higher Imp-weighted degradation share behaves differently at the string level than one degrading evenly, and the mismatch that accumulates between modules over 15–20 years can quietly erode performance ratio in ways a simple "0.5%/year" assumption never catches. Layer in the manufacturer's warranty curve on the same chart, and you can see — visually — whether your design's actual degradation trajectory stays inside the warranty guarantee or breaches it before end of life.
Grid-Code and Auxiliary Losses: The Ones People Forget
Underperformance doesn't only come from the array. Reactive power reserve derates, ramp-rate limiting, transformer no-load and copper losses, site auxiliary consumption, and night-time inverter standby draw all quietly eat into delivered energy — and they're exactly the losses that get left out of early-stage estimates because they don't show up until you model the actual grid connection. The simulator computes each of these explicitly and folds them back into the loss table, so nothing sits outside the picture.
From Diagnosis to Correction — Inside the Same Tool
The real value isn't just finding what's underperforming — it's that every diagnostic feeds directly back into your design decisions without leaving the app:
- See high electrical shading loss? Adjust row spacing and re-run — the bypass-diode model reflects the new geometry immediately.
- See a mismatch problem emerging by Year 15? Revisit sigma Isc/Voc inputs or bypass diode configuration.
- See clipping eating more than expected? Adjust your ILR and watch the loss table update in real time.
Nothing here requires exporting to a separate analysis tool, recalculating in a spreadsheet, and re-importing results. The diagnosis and the fix live in the same simulation loop.
Conclusion
A plant that "just works" isn't good enough for a bankable design — you need to know why it works, and exactly how much margin sits between your projected performance and reality. By breaking every loss down to its physical cause, tracking it across the full project life, and feeding every fix straight back into the simulation, IST PVSolar Simulator turns underperformance from a mystery you discover after commissioning into a problem you solve at the design table.