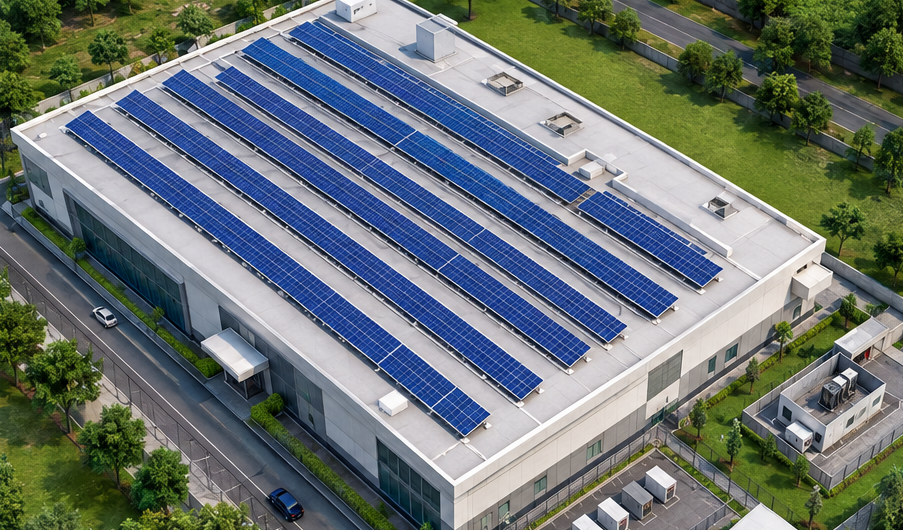
3D Layout Design in IST PVSolar Simulator: What Actually Happens in Three Dimensions
"3D solar design" gets used loosely across the industry — sometimes it means a rendered image of panels on a roof, sometimes it means genuine geometric modeling that feeds real calculations. In IST PVSolar Simulator, the 3D layer isn't decoration sitting on top of a 2D calculation — it's where real terrain, real neighboring structures, and real module geometry get modeled and then fed directly into the energy simulation. Here's what's actually happening underneath it.
Real Terrain, Not an Assumed Horizon
Far-horizon shading is built from actual Digital Elevation Model data — Copernicus DEM GLO-30/90. The model samples elevation at multiple radii around your site — from 120 meters out to 40 kilometers — across up to 72 azimuth bins, calculating the horizon angle in each direction by comparing elevation rise against your site's own elevation, correctly accounting for Earth's curvature at longer distances. That horizon profile can be cross-checked against PVGIS's independently computed horizon for the same coordinates, so the terrain feeding your 3D model comes from real geography, not an assumed flat horizon.
Real Buildings, Not Generic Obstructions
Near-field shading comes from actual building data queried live from real footprint polygons, real orientation (calculated from a proper best-fit rotation of each building's actual edges, not assumed north-aligned), and real height, pulled from OSM's tagged data where available or derived from building-levels count where it isn't. Only structures within your relevant radius are included, sorted by distance, so the 3D obstructions in your model reflect what's actually near your site — not a category assumption about "urban" shading.
Module Geometry Segmented for Rear-Irradiance Modeling
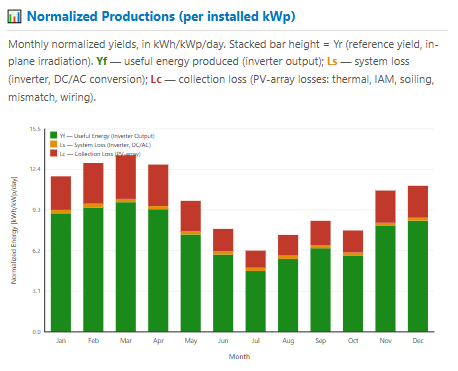
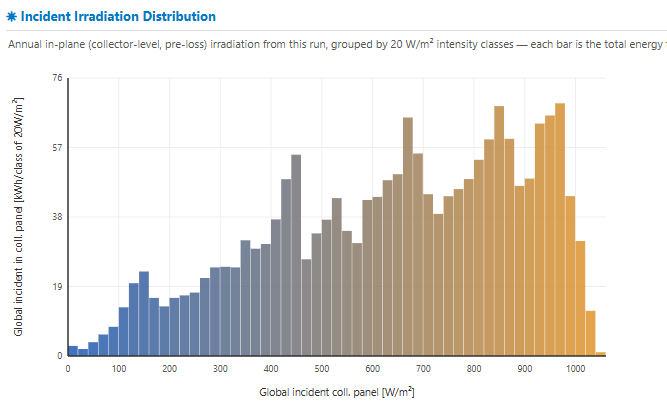
For bifacial arrays, the 3D geometry goes beyond visualization into physics. The ground beneath and between rows is divided into discrete segments, each tracked for shading status at every timestep. The module face itself is segmented along its slant height, and real geometric view factors are calculated between each module cell and each ground segment, the open sky, and the adjacent row — the same view-factor principle used in radiative transfer calculations, applied here to compute how much reflected light actually reaches the rear of a bifacial module from a specific mounting height, tilt, and row spacing.
Multi-Face Roofs as Real 3D Surfaces
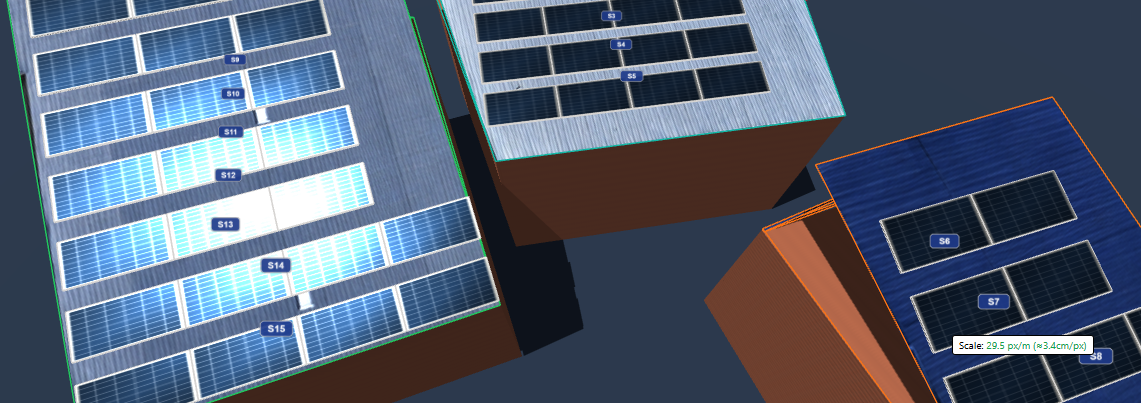
Rooftops rarely offer one clean orientation, and the platform models them accordingly — azimuth, pitch angle, and mounting type tracked independently per roof face, so a hip roof or a mixed flat/pitched commercial building or ground mount is represented as the multi-plane surface it actually is, not averaged into a single fictional tilt that would understate loss on the worst-facing section and overstate it on the best.
Sun Path and Shadow Rendering: Seeing the Geometry Work
Once terrain, buildings, and module layout are in place, the 3D Site Preview renders all of it together — your panel layout on the actual roof or ground plane, with the sun's path traced across the sky and shadows falling exactly where the underlying geometry calculates they will. This isn't a separate visualization disconnected from the numbers; a shading conflict that's invisible in a spreadsheet — a shadow crossing three rows at 4 PM in December — becomes visible here, because it's rendered from the same geometric model driving the shading-loss calculation.
Why 3D Has to Feed the Simulation, Not Just Illustrate It
The distinction that actually matters: this 3D geometry isn't a rendering layer sitting beside the energy calculation — it's an input to it. The horizon profile computed from real DEM data becomes the far-horizon shading loss in your hourly simulation. The building obstructions computed from real OSM geometry become part of the same shading calculation. The view-factor rear-irradiance model computed from real module and ground segmentation becomes your bifacial gain figure in the loss table. If the 3D model were disconnected from the simulation — a nice picture that doesn't actually inform the energy yield — it would be worth far less than what it is here: the geometric foundation the yield number is actually built on.
Conclusion
Genuine 3D layout design means the geometry you see is the geometry the energy calculation is using — not a visualization that happens to sit next to a separately estimated yield. By building far-horizon shading from real elevation data, near-field shading from real building footprints, and bifacial gain from real per-cell view-factor geometry, and feeding all of it directly into the same hourly simulation that produces your final energy figures, the 3D layer here does the work an energy assessment actually needs from 3D modeling — not just a rendering of where the panels go.