Inside the 3D Shadow Analysis Engine of IST PVSolar Simulator 9.0.10
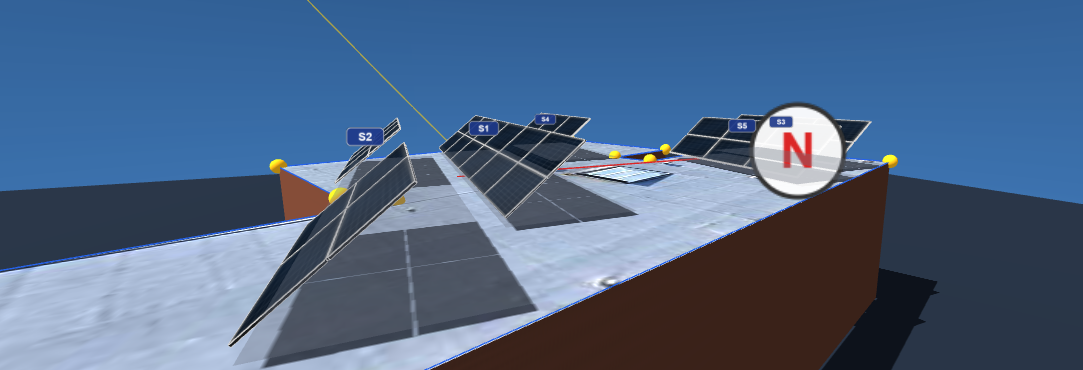
Shading is the single most under-modeled variable in solar design. A row of trees, a neighbor's chimney, or even the array's own rows shading each other at low sun angles can quietly erase 5–15% of a plant's annual yield — and most simple design tools handle it with a single flat "shading loss %" typed in by hand. IST PVSolar Simulator 9.0.10 takes a different approach: a full 3D Shadow Analysis module that turns a drone photo (or even a plain roof snapshot) into a geometrically accurate, hour-by-hour shading model that feeds directly into the plant's energy simulation. The 3D environment allows designers to visualize potential shadows and understand how shading can affect a PV installation before the system is constructed.
Here's what's actually happening under the hood.
It starts with real-world geometry, not guesswork
Instead of asking for a rough site sketch, the tool accepts genuine survey-grade inputs: JPG/PNG orthomosaics, GeoTIFFs (decoded entirely in-browser, including automatic selection of a lower-resolution pyramid level for very large files), world files (.tfw/.jgw/.pgw/.wld) for scale calibration, GeoJSON/KML/KMZ boundaries that auto-trace the site outline, and even LAS/LAZ point clouds for elevation statistics. JPEGs are scanned for embedded EXIF GPS tags automatically, and if an image comes in under the recommended resolution, an in-browser AI super-resolution model can sharpen and double it before tracing begins.
Once an image is loaded, every other measurement in the tool derives from a single scale calibration: draw a line across a known real-world distance, and every subsequent panel, obstruction, and shadow length is computed in true meters, not arbitrary pixels.
Tracing the site: roofs, obstructions, and everything that casts a shadow
The tracing toolkit goes well beyond a simple outline. Roofs can be flat or multi-face pitched — including an "Auto (Full Roof)" mode that takes a single outline and a pitch angle, and automatically generates a complete hip roof with correctly-sloped faces, hips, and valleys, entirely from geometry (no manual face-by-face tracing required). Sixteen categories of obstructions can be marked individually — buildings, trees, electrical posts, chimneys, antennas, HVAC ventilators, existing solar arrays, and more — each with its own icon, its own 3D render style (a tree renders as a cone canopy on a trunk; a building extrudes as a full 3D mass), and its own height input.
Two detection tools reduce manual tracing further:
- AI Detect scans the photo around the roof for tree-like shading objects using a local color heuristic.
- Shadow Scan analyzes the photo's actual brightness values against the roof's own average luminance to flag panels sitting under a visibly darker area — catching real shadows present at the moment the photo was taken, independent of any time-of-day calculation.
For genuine one-off obstacles — a vent pipe, a satellite dish bracket — there's also Draw Shadow Area: trace the object's real footprint, give its height, and the tool projects its actual shadow at the current sun position and removes any panels that fall inside it, permanently excluding that footprint from future auto-fill.
The solar position engine, not a shortcut formula
This is where the module distinguishes itself technically. Rather than using a simplified declination approximation, the 3D Shadow Analysis engine implements the full Solar Position Algorithm (SPA) — the same reference-grade algorithm used in professional-grade tools — complete with Earth heliocentric longitude/latitude/radius series, nutation-in-longitude and obliquity corrections, aberration, atmospheric refraction correction, and real sidereal-time-based hour angle calculation from longitude (not just a rounded time-zone offset). The result is sun elevation and azimuth accurate to a small fraction of a degree, which matters most exactly where shading calculations are most sensitive: low sun angles at dawn, dusk, and winter solstice.
Automatic row spacing that actually checks the sky
Rather than asking a designer to guess a row pitch and hope it's enough, the Seasonal Pitch Calculation tool searches Winter, Spring Equinox, Summer, and Autumn Equinox design days across a configurable morning-to-evening window, finds the single worst-case (lowest) sun elevation in that window for each season, and computes the exact row-to-row pitch needed so no row shades the one behind it at that worst moment — governed by whichever season turns out to need the most spacing. It reports the classic V/F/gap/pitch geometry breakdown, and a companion Row Pitch Calculator table shows the full per-season comparison (minimum altitude, worst hour, suggested pitch, resulting GCR) so a designer can see exactly which season is driving the spacing decision, and override it manually if needed.
A one-click 🔁 worst-hour Re-Calculate button ties this all together: it clears the array, re-runs Auto Fit, and re-applies the seasonal spacing check in one pass.
Shading, quantified — and rendered
Once the layout is placed, the tool computes actual shadow-casting geometry: convex-hull shadow polygons for every obstruction and parapet line, and per-string shadow projections that account for each row's own tilt and back-edge rise (with pitched-roof, flush-mounted strings correctly excluded from casting a shadow on their neighbors, since they don't have a raised back edge). Every panel is checked against every other string's shadow and every object's shadow, and the results are broken down per string: how many panels are shaded by row-to-row shading versus by trees/buildings/parapets, with the specific casting string identified by name.
Two visualizations make this legible at a glance:
- A Sun Path 2D Chart plots the full annual sun-path envelope (one curve per month, hour-of-day cross-lines, month and hour labels auto-decluttered to avoid overlap) with the actual shaded arc of each month's path shaded in gray — so a designer can see, at a glance, exactly which hours of which months lose sun to a specific obstruction, plotted at its real bearing and elevation as seen from the roof.
- A Row Pitch Diagram draws the actual mounting table geometry to scale — front and back edge heights, table footprint, row pitch, and (for bifacial modules) a computed ground-albedo-availability percentage and estimated bifacial energy gain, derived from the layout's real height-to-ground-view-factor, not a flat assumption.
From flat estimate to a full hourly profile
The headline feature is what happens when a designer clicks ✔ Apply Shading Loss to Simulation. The module doesn't just push a single annual percentage into the loss table — it computes a full 12-month × 24-hour shading profile from the exact traced layout, running the shadow calculation at every month/hour combination for the whole year. That grid is handed to the main simulation engine, where it replaces the generic row-shading formula with the site's real, geometry-derived shading pattern, run through a proper bypass-diode partial-shading electrical model rather than a simple linear derate.
If the selected module is bifacial, the same real geometry — actual measured pitch, GCR, and mounting height — feeds the rear-irradiance calculation too, including a ray-traced correction for any obstacle that blocks part of the ground or sky view from the rear side, replacing a manually-entered assumption with the layout's real numbers.
Why this matters
Shading analysis is usually where solar design tools split into two camps: cheap tools that ask for a flat percentage, and expensive enterprise suites that require a separate license and a trained operator. The 3D Shadow Analysis module in IST PVSolar Simulator 9.0.10 aims squarely at the middle — real orthomosaic-based geometry, a reference-grade solar position algorithm, automatic seasonal row-spacing, and a full hourly shading profile that flows straight into the bankability-grade simulation engine, all running client-side in a browser tab.
That's the difference between designing around shading and actually knowing exactly what it costs, month by month, hour by hour.