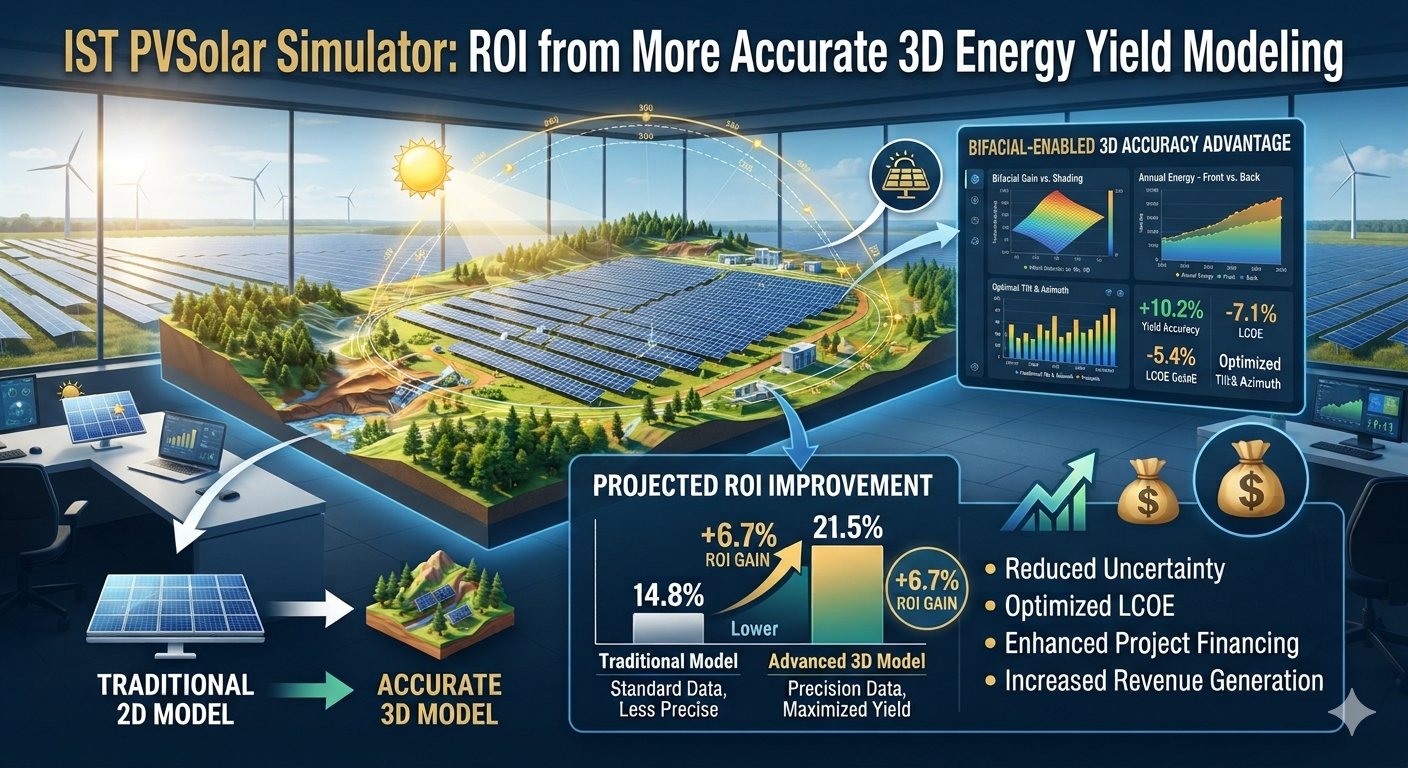
Calculate Your ROI from More Accurate 3D Energy Yield
Every financial projection in solar — IRR, NPV, payback period, DSCR — is only as trustworthy as the energy yield number sitting underneath it. Get that number wrong by even a few percentage points, and every downstream calculation inherits the error: a lender's covenant looks safer than it is, an equity IRR looks more attractive than it will actually be, a payback period quietly slips a year past what the spreadsheet promised. IST PVSolar Simulator closes that gap by feeding its financial engine from a genuinely 3D-modeled energy yield — not a flat annual estimate dressed up to look precise.
IST PVSolar Simulator, the strongest ROI argument is not simply “better 3D visualization.” It is:
More accurate representation of the real site → more reliable shading and energy-yield estimation → better engineering decisions → lower revenue uncertainty.
The Problem with ROI Built on Simplified Yield
Most quick financial models start from a single annual kWh/kWp figure, sometimes adjusted with a generic shading derate. That number then flows into NPV, IRR, and payback calculations that look mathematically rigorous — multiple decimal places, discounted cash flow tables, sensitivity bands — while resting on an energy estimate that never accounted for the actual building 40 meters away, the real row-to-row shading pattern, or how bifacial gain changes with your specific mounting height and albedo.
The financial model can be perfect. If the yield feeding it isn't, the ROI is fiction with good formatting.
Where the Extra Accuracy Actually Comes From
IST PVSolar Simulator's yield calculation isn't a single formula — it's a stack of physically modeled effects that each move the final energy number in ways a simplified estimate can't capture:
- Real terrain and real neighboring buildings. Horizon shading pulled from actual Copernicus DEM elevation data, combined with OpenStreetMap building footprints and heights around your specific coordinates, means far-horizon and near-obstruction losses reflect your site — not an assumed open-sky condition.
- Electrical shading via bypass-diode modeling. Partial shading on a string doesn't get applied as a proportional derate; it's run through an actual I-V curve model that reflects how bypass diodes reshape the power output under real shading patterns.
- Bifacial gain from view-factor geometry. Rear-side irradiance is computed cell-by-cell from your row spacing, mounting height, and ground albedo — not estimated with a flat bifacial-factor multiplier.
- Perez transposition and single/two-diode electrical modeling, run at hourly or sub-hourly (15-minute) resolution against real TMY weather data from NASA POWER or PVGIS — not a monthly-average approximation.
- Grid-code and auxiliary losses — reactive power reserve derates, ramp-rate limiting, transformer and cable losses, site auxiliary consumption — folded into the delivered energy figure before it ever reaches the financial model.
None of these are edge cases. They're the differences between a P50 yield estimate that survives an independent engineer's review and one that gets flagged as optimistic.
From Accurate Yield to Defensible ROI
Once the energy model reflects your actual site geometry, every financial output built on top of it becomes more than a spreadsheet exercise:
- LCOE is calculated from real annual energy output, discount rate, and project life — not a rounded yield assumption.
- NPV and IRR run against a cash flow series built on your simulated P50 (or P90, for lender base cases) energy delivery, year over year, including degradation and mismatch effects from the full lifetime re-simulation.
- DSCR — minimum and average — is checked against your actual debt structure using energy that reflects your real shading losses, not a generic derate that might be hiding a covenant breach two years into operation.
- Monte Carlo financial simulation stress-tests CAPEX overruns, interest rate shocks, and tariff reductions against a yield distribution that already accounts for interannual variability (IAV%) pulled from real multi-year weather records — so your P10/P50/P90 energy bands feed directly into P10/P50/P90 financial outcomes.
This is the difference between a financial model that assumes a yield and one that's stress-tested against a yield that was itself derived from real physics.
Why This Matters for Financial Close
Independent engineers and lender technical advisors don't just check whether your IRR calculation is arithmetically correct — they check whether the energy assumption underneath it holds up. A yield estimate that ignores a nearby building's shadow, treats bifacial gain as a flat bonus, or skips grid-code derates entirely is exactly the kind of assumption that gets challenged during due diligence, sometimes late enough in the process to delay financial close.
Starting from a 3D-modeled, physically validated energy yield means your ROI numbers are the same ones that survive that scrutiny — because they were built the same way an independent engineer would check them, not backfilled to hit a target IRR.
Conclusion
ROI isn't a financial exercise bolted onto a design — it's a direct consequence of how accurately you modeled the energy the plant will actually produce. By grounding every financial output in a yield calculation that accounts for real terrain, real shading, real bifacial geometry, and real grid-code constraints, IST PVSolar Simulator makes sure the IRR and payback period you present to investors are numbers that hold up — not just on the page, but under review.