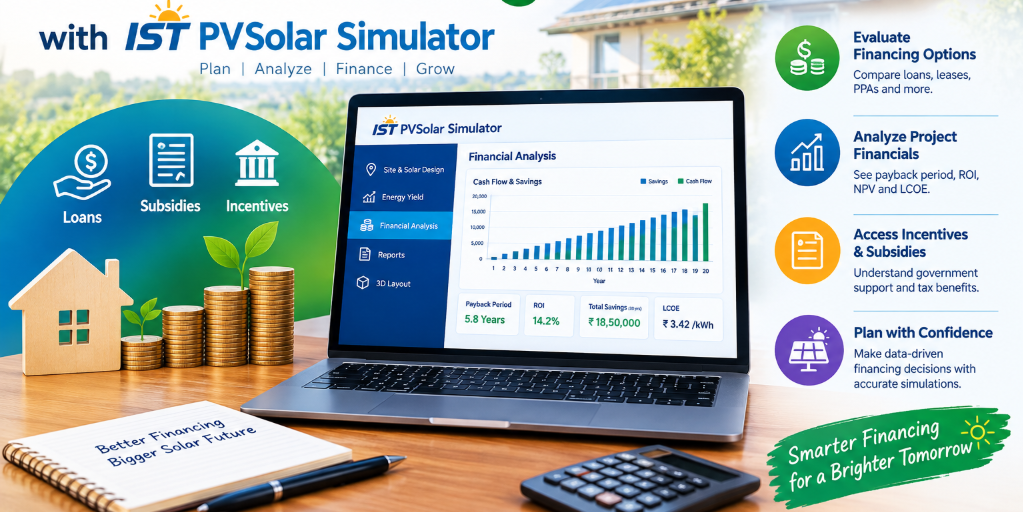
Understanding Solar Financing with IST PVSolar Simulator
Financing is where a lot of technically sound solar projects stall. A well-designed system with an accurate energy yield still needs to answer the questions a lender, an investor, or a business owner will actually ask: what does this cost, how is it paid for, what's the return, and how safely can debt be serviced from the cash it generates? IST PVSolar Simulator treats financing as a full modeling discipline in its own right — not an afterthought bolted onto the energy simulation — and here's how that plays out across the platform.
CAPEX: Itemized, Not Assumed
The financial model starts with a real capital expenditure breakdown rather than a single lump-sum guess. Individual CAPEX line items — quantity, unit, rate, and applicable tax — roll up into a total investment figure, so the number driving every downstream financial calculation is built from your actual cost structure, not a generic $/Wp estimate. Capex bands are also available as a reference benchmark, letting you sanity-check your total investment per watt against typical ranges for your project segment.
OPEX and the Full Cash Flow Picture
Annual operating expenses — O&M, insurance, land lease, and other recurring costs — are modeled explicitly, with escalation applied year over year alongside tariff escalation and module degradation. This is what turns a single-year snapshot into a genuine multi-decade cash flow projection: revenue that degrades and escalates realistically against costs that do the same, rather than a flat "Year 1 numbers times project life" shortcut.
Financing Structure: Equity, Debt, and Subsidy, Modeled Together
A project's total investment splits across own funds, subsidies or grants, and debt — and the platform models that split explicitly rather than treating financing as a single blended cost of capital. Loan amount, interest rate, tenure, and moratorium period feed into an actual amortization calculation (EMI computed properly, not approximated), and the financing structure view shows exactly what percentage of total CAPEX each source covers — own fund, subsidy, and debt — so the capital stack is transparent from the start.
Taxes and Depreciation: Where Real Project Economics Often Get Missed
This is a detail many simplified tools skip entirely, and it can materially change a project's actual return. The platform models depreciation (including written-down value method), applicable tax rate, additional depreciation where relevant, and tax holiday periods — all flowing into the actual net cash flow calculation rather than treating pre-tax cash flow as the final answer. For jurisdictions where accelerated depreciation is a genuine part of the investment case, ignoring it in a financial model doesn't just introduce a small error — it can make an attractive project look mediocre, or vice versa.
The Core Return Metrics: NPV, IRR, LCOE, Payback
With CAPEX, OPEX, financing, taxes, and degradation all in place, the platform calculates the metrics that actually get compared across investment decisions:
- LCOE — levelized cost of energy, calculated from CAPEX, OPEX, annual energy, discount rate, project life, and degradation rate together, not from a simplified capital-cost-only formula.
- NPV and IRR — computed from the full discounted cash flow series, including tax and depreciation effects.
- Simple and discounted payback period — both reported, since the two can diverge meaningfully once financing costs and time value of money are properly accounted for.
- Profitability Index (PI) — a normalized measure of value created per unit of capital invested, useful for comparing projects of different sizes.
Beyond Project-Level Returns: Debt Serviceability
For any project with meaningful debt financing, project-level IRR isn't the number a lender actually cares about most — debt service coverage is. The platform calculates minimum and average DSCR across the loan tenure from the actual debt service series and cash flow available for debt service, checked against configurable covenant thresholds (a minimum DSCR of 1.20x and average of 1.30x are common lender benchmarks, and both are explicitly parameterized rather than hardcoded). Loan Life Coverage Ratio (LLCR) is factored into the bankability assessment as well, giving a fuller picture of debt serviceability than a single DSCR snapshot.
Equity-level metrics are calculated alongside project-level ones — equity IRR, equity NPV, equity payback — because the return an equity investor actually earns, after debt service, financing costs, and leverage effects, is a different (and usually more relevant) number than the unlevered project IRR.
Stress-Testing the Numbers: Monte Carlo Financial Risk
A single-point financial projection tells you what happens if every assumption holds exactly. Real projects don't work that way, which is why the platform runs a Monte Carlo simulation — thousands of trials sampling variation in the key financial and energy inputs — producing P10/P50/P90 bands for NPV, IRR, LCOE, and DSCR, not just a single base-case number.
Beyond the Monte Carlo distribution, the platform runs explicit stress scenarios that lenders and investors specifically ask about: a CAPEX overrun of +15%, an interest rate shock of +200 basis points, and a tariff or revenue reduction of −10% — each showing the resulting DSCR and LCOE impact, classified as low, medium, or high risk against your covenant thresholds. That's the difference between saying "our DSCR is 1.35x" and being able to answer "what happens to that DSCR if construction costs run over" with an actual calculated number instead of a verbal reassurance.
Financing Terms as Part of the Bankability Assessment
Financial structure doesn't sit in isolation from the broader bankability picture — the assessment ties project-level and equity-level financial covenants directly into the same risk scoring used for technical and legal review. Minimum DSCR below threshold, project IRR below the required 12% unlevered benchmark, or an equity IRR that doesn't clear the cost-of-equity hurdle all surface as explicit conditions-precedent items — the same language and severity classification a lender's own due diligence team would use, so the financial section of your report speaks the language reviewers actually expect.
Currency and Presentation, Handled Properly
None of this analysis is useful if it's not presented in the right currency and unit convention for your audience — the platform supports currency selection with appropriate locale formatting and unit scaling (lakhs, millions, etc. depending on region), so a report prepared for an Indian lender and one prepared for an international investor both present the same underlying numbers in the format each audience actually expects.
Why Financial Modeling Depth Matters as Much as Energy Modeling Depth
It's worth stating plainly: a sophisticated energy yield calculation feeding an oversimplified financial model produces a report that's only half-defensible. Depreciation and tax effects, DSCR and LLCR against real covenant thresholds, equity-versus-project-level returns, and genuine stress testing against CAPEX overrun and rate shock scenarios — these aren't optional extras, they're the specific things an investment committee or a lender's technical advisor will check before committing capital. A financial model that skips them isn't simpler, it's incomplete.
The Bottom Line
Understanding solar financing means understanding that the energy yield is only the input — the real financial story is in how CAPEX, OPEX, taxes, depreciation, and debt structure combine into a cash flow that actually has to service a loan and deliver a return over 20-plus years. By modeling that full chain — itemized CAPEX, real amortization, tax and depreciation effects, DSCR and LLCR against explicit covenants, equity-level returns, and genuine stress testing — IST PVSolar Simulator gives you a financial picture built to survive the same scrutiny a lender or investor will actually apply, not just a projection that looks convincing until someone asks the harder questions.