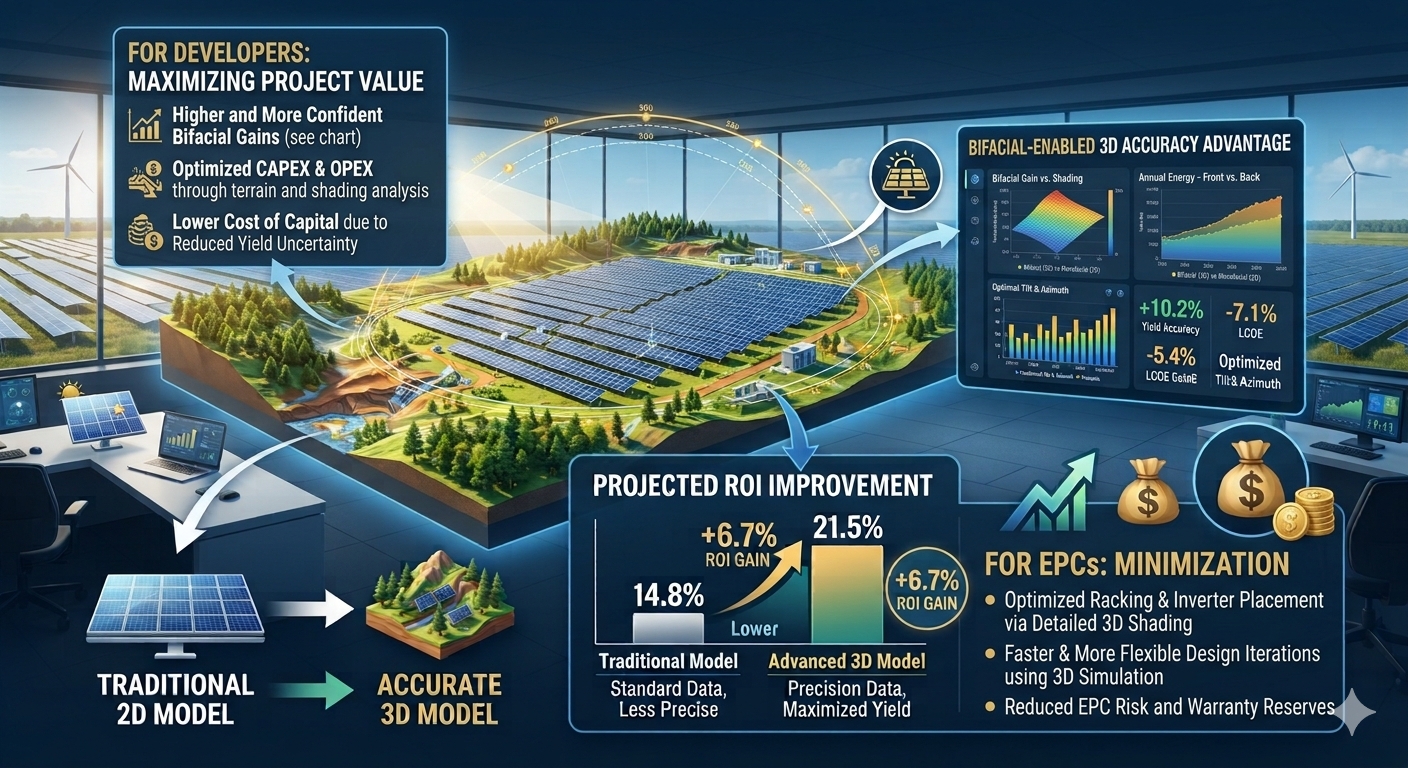
Why Developers and EPCs Choose a Detailed 3D Energy Tool Over a Quick Estimate
Every solar developer and EPC has, at some point, been burned by a yield number that looked fine on paper and fell apart in the field — or worse, in front of a lender. That experience is usually what pushes teams away from quick-estimate tools and toward something that models a site the way it actually exists in 3D. Here's what that shift actually buys you, and why it's becoming the default expectation rather than a nice-to-have.
The Problem Simplified Tools Create Downstream
A flat annual yield estimate with a generic shading derate is fast to produce and fine for a first-pass feasibility check. The trouble starts the moment that number gets used for anything with money attached to it — a financing application, an EPC contract with performance guarantees, or a client proposal with an IRR promise in it. At that point, every simplification in the yield calculation becomes a liability someone eventually has to explain.
Independent engineers know where to look. Lenders' technical advisors know where to look. And when the answer to "how did you account for that neighboring building's shadow?" is "we used a flat 2% urban shading assumption," that's the moment a deal slows down.
What a Detailed 3D Model Actually Changes
Developers and EPCs who move to a genuinely 3D-modeled workflow aren't chasing a prettier interface — they're closing specific gaps that simplified tools leave open:
Site-specific shading, not assumed shading. Real elevation data (Copernicus DEM) for far-horizon shading, and real building footprints and heights (from OpenStreetMap) for near-obstruction shading, mean the loss figure reflects the actual site — not a category like "urban" or "rural" mapped to a lookup table.
Electrical behavior, not proportional derating. A bypass-diode I-V model captures how partial shading actually reshapes a string's power curve, instead of treating shaded modules as a linear percentage cut. This is the difference between a shading loss number that's approximately right and one that's mechanistically correct.
Bifacial gain from geometry, not a flat multiplier. View-factor modeling computed cell-by-cell across row spacing, mounting height, and albedo means bifacial gain claims are defensible against the specific design — not an industry-average bump applied to every project regardless of layout.
Hourly and sub-hourly resolution against real weather. NASA POWER and PVGIS TMY data, run through Perez transposition and single/two-diode electrical modeling at 15-minute resolution, produces a P50/P90 energy distribution that holds up under Monte Carlo financial stress testing — because the underlying yield already reflects real interannual variability, not a smoothed monthly average.
Why EPCs in Particular Gravitate Toward This
For an EPC, the stakes are different from a developer's — an EPC is often the one signing a performance guarantee tied to that yield number. A detailed 3D model that correctly accounts for shading, bifacial gain, and grid-code derates before the contract is signed is the difference between a guarantee an EPC can stand behind and one that quietly assumes best-case conditions that may not materialize.
The same logic extends into deliverables an EPC actually has to produce: single line diagrams and wiring schedules generated from the real electrical solution (validated MPPT current, voltage windows, cable drop) rather than a generic template, and a bill of quantities derived from the actual module/inverter/string configuration rather than a rough estimate.
Why Developers Gravitate Toward This
For a developer chasing financial close, the detailed model changes what a bankability report can actually claim. A risk flag that says "module efficiency is below the 20% benchmark" or "PR guarantee is below the ≥80% threshold" is only useful if the underlying yield feeding that assessment is itself defensible. A bankability scorecard built on a simplified yield estimate is a scorecard an independent engineer can dismiss in one meeting.
Developers also feel the difference in what a detailed 3D model does to financing terms directly — DSCR calculations, equity IRR, and covenant compliance all shift when the energy assumption underneath them accounts for real shading rather than an optimistic average. Getting that right before signing a PPA or a loan agreement is worth far more than the extra modeling time it takes upfront.
The Real Reason This Becomes the Default Choice
It's rarely about wanting more detail for its own sake. It's about not wanting to discover the gap between assumed and actual performance after the plant is built, the contract is signed, or the loan is disbursed. A detailed 3D energy tool moves that discovery to the design table, where it costs a re-run of the simulation — instead of to commissioning or Year 3 of operation, where it costs a dispute.
Conclusion
Developers and EPCs don't choose a detailed 3D energy tool because it's more impressive-looking. They choose it because every simplification a quick-estimate tool makes eventually has to be explained to someone with money on the line — a lender, an independent engineer, or a client holding a performance guarantee. A tool that models real terrain, real buildings, real electrical shading, and real bifacial geometry from the start means that conversation never has to happen, because the number was right the first time.