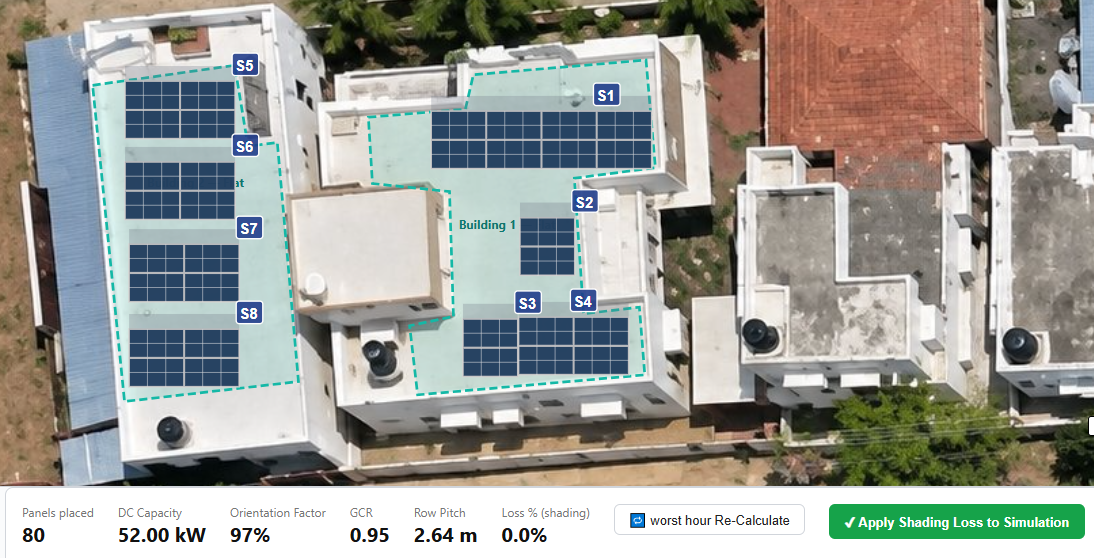
Efficient Solar Layouts in IST PVSolar Simulator
An efficient solar layout isn't the one that fits the most panels on a site — it's the one that produces the most energy per rupee of investment while respecting land constraints and holding up electrically once it's built. Getting there requires balancing tilt, row spacing, string sizing, and inverter loading against each other, since a change to any one shifts what's optimal for the rest. Here's how IST PVSolar Simulator approaches that balance as a connected engineering problem rather than a series of separate guesses.
Start With Tilt and Azimuth — Calculated, Not Assumed
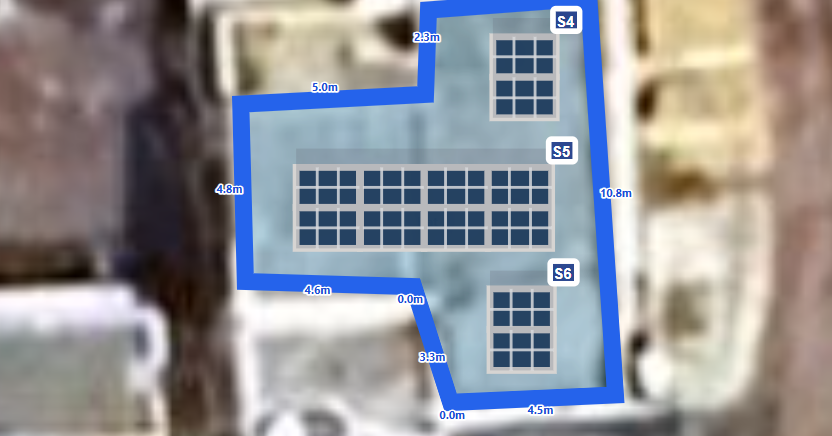
Layout efficiency begins with orientation, and the Auto-Optimize Tilt function finds it by sweeping tilt angles from 0° to 60° against your actual monthly weather data and albedo, calculating annual H_POA at every step to identify the true optimum for your specific site. If structural, land, or aesthetic constraints push your actual tilt away from that ideal, the orientation loss calculation quantifies exactly what that tradeoff costs — a defensible number instead of an unmeasured assumption.
Row Spacing Sized to the Physics, Not a Safety Margin
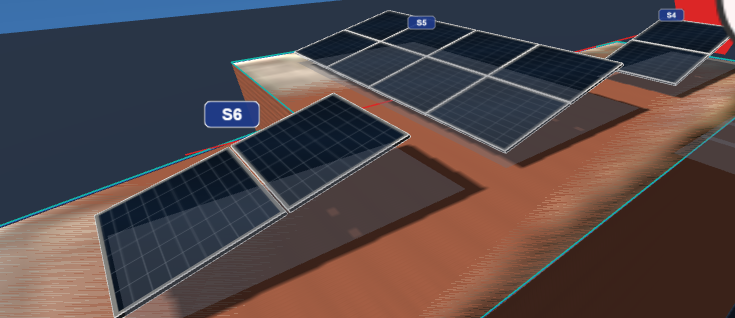

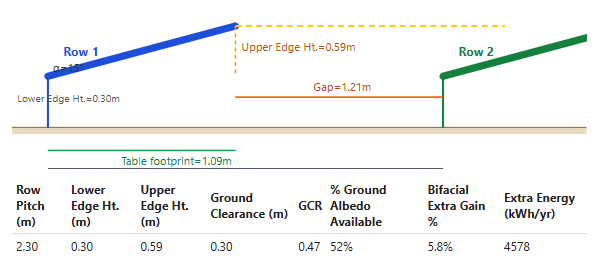
Over-spacing rows to be cautious wastes expensive land; under-spacing costs energy to inter-row shading. The Unlimited Sheds 2D model calculates the actual shadow-free pitch from your tilt, module height, and row gap — the minimum spacing at which one row stops shading the next across the full operating year. That geometry then feeds directly into the electrical shading model used in the hourly simulation, so your spacing decision and your shading-loss number come from the same source rather than two independently estimated figures.
Tracker Layouts: The Density-Versus-Gain Tradeoff, Modeled Explicitly
For single-axis tracker projects, layout efficiency is fundamentally a ground coverage ratio (GCR) decision — tighter GCR packs more capacity per hectare but forces more backtracking, limiting how far trackers rotate before rows shade each other. The SAT module computes actual rotation angle at every timestep under your chosen mode (backtracking or true-tracking) and GCR, then shows the resulting annual gain, monthly average tracker angle, and a full loss waterfall from soiling through clipping — letting you see exactly where a tighter GCR starts trading tracking gain for density, instead of picking a GCR from a rule of thumb.
Electrical Layout: Efficient and Validated at the Same Time
A geometrically efficient layout can still fail electrically if string sizing doesn't match the equipment. As you configure modules per string, strings per MPPT, and inverters per array, the platform checks Voc at minimum winter temperature against inverter max DC voltage, Vmp at both temperature extremes against the MPPT window, and array current against per-MPPT limits — computed from real single-diode I-V modeling rather than linear approximation. That validation happens before you commit the sub-array, so an efficient-looking layout is also a workable one.
DC/AC Ratio: The Efficiency Tradeoff Every Layout Makes
Inverter loading ratio (ILR) is where layout efficiency becomes directly financial. A higher ILR captures more low-light energy per inverter but increases clipping loss at peak output. The clipping loss calculation runs from your actual ILR and flows immediately into the loss table and financial model in the same session, so specific yield and CAPEX per watt move together as you adjust ILR — letting you find the point where added DC capacity stops paying for itself.
Complex Roofs and Bifacial Arrays: Efficiency Per Face and Per Geometry
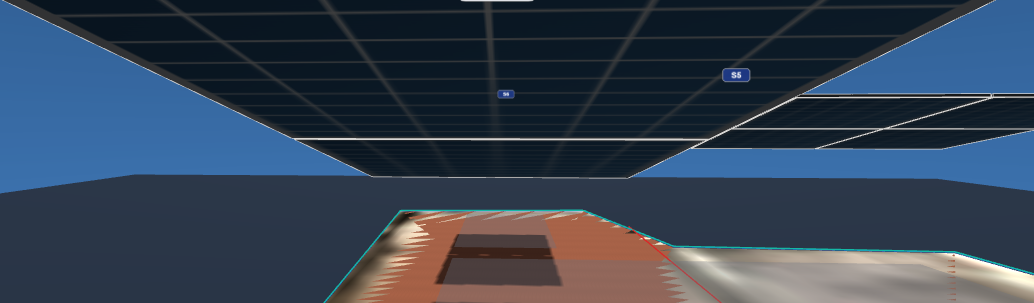
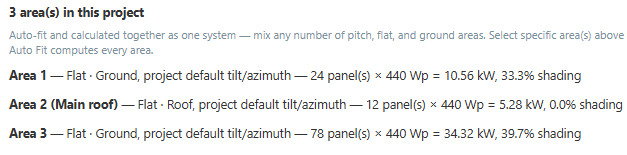
Real rooftops rarely offer one clean orientation, so the layout engine tracks azimuth, pitch, and mounting type independently per roof face — a multi-face roof gets simulated as the multi-plane system it actually is, not averaged into a single misleading tilt. For bifacial arrays, mounting height and row spacing become efficiency levers in their own right: the view-factor bifacial model computes rear gain directly from pitch, height, and albedo, so raising a table's height shows up as a quantified bifacial gain you can weigh against the added structural cost.
From Optimized Layout to Buildable Wiring Plan
An efficient layout only stays efficient if it survives translation into construction documents. The wiring diagram tool builds string-to-MPPT assignment and cable routing directly from your finalized panel positions and equipment specs, sizing cables to stay within your target voltage drop — closing the loop between the layout you optimized for yield and the schedule a crew will actually build from, with no manual re-drawing step where efficiency gets lost in translation.
Why These Decisions Can't Be Optimized One at a Time
Tilt, row spacing, GCR, string sizing, and ILR are interdependent: change tilt and your shadow-free pitch shifts with it; change GCR and your tracker's backtracking behavior shifts; change ILR and your string sizing needs shift. Every one of these interactions ultimately shows up in the same loss table and the same financial model — which is why running them through one connected simulation, rather than five separately optimized calculators, is what actually produces an efficient layout instead of five efficient-looking pieces that were never checked against each other.
Conclusion
An efficient solar layout balances competing constraints rather than maximizing any single one — the right tilt for your resource, the tightest spacing your shading tolerance allows, an inverter loading ratio that captures energy without wasting it to clipping, and an electrical configuration validated before it's built. By running tilt optimization, shadow-free pitch calculation, tracker geometry, electrical validation, and bifacial modeling through the same simulation engine, IST PVSolar Simulator lets you find that balance directly for your specific site and equipment, instead of assembling a layout from independently optimized guesses and discovering the mismatch after construction.